We all know how the COVID-19 pandemic has dramatically changed the way team’s work this year – and possibly forever. Video calls, chat, and other forms of remote communication are becoming even more important as teams adjust how to stay productive and connected while out of the office.
This shift helped us decide it was time to finally build out the Slack/Teams integration we had long been planning.
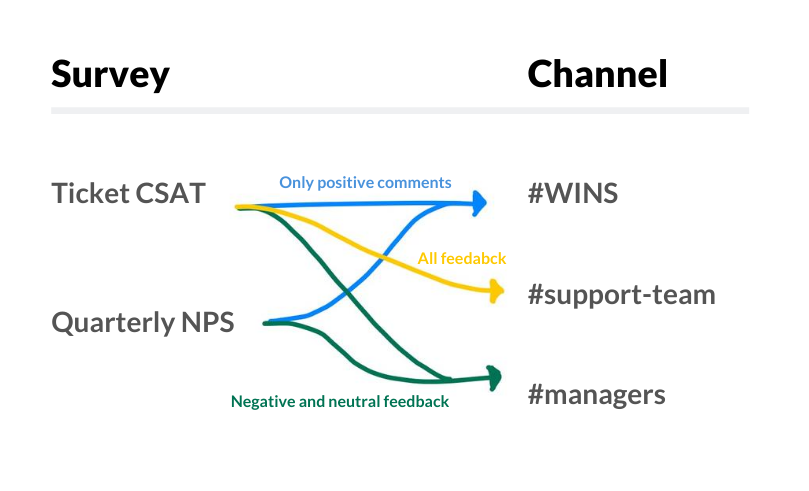
The integration is super flexible, giving you the ability to choose which types of instant notifications and summaries go to different channels.
For example, you could send only positive responses with comments from multiple surveys to a single #WINS channel, or only negative and neutral responses to a #managers channel. It’s up to you!
Custom survey channel routing
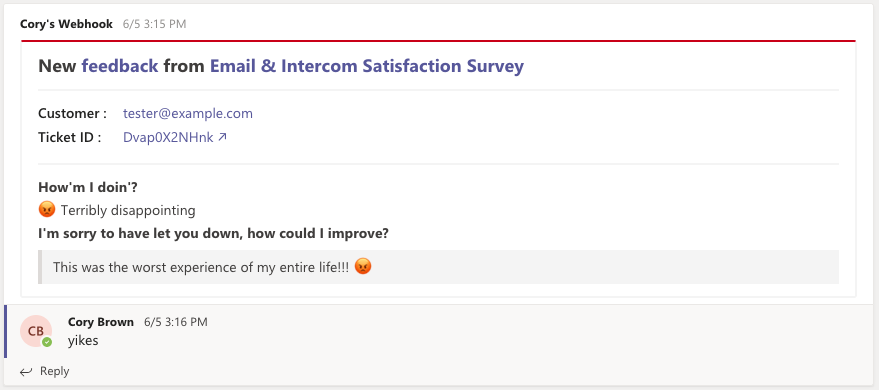
Instant notifications contain all response information, including helpful links back to the response, customer, or opening the ticket directly in your service desk.
Microsoft Teams instant feedback notification
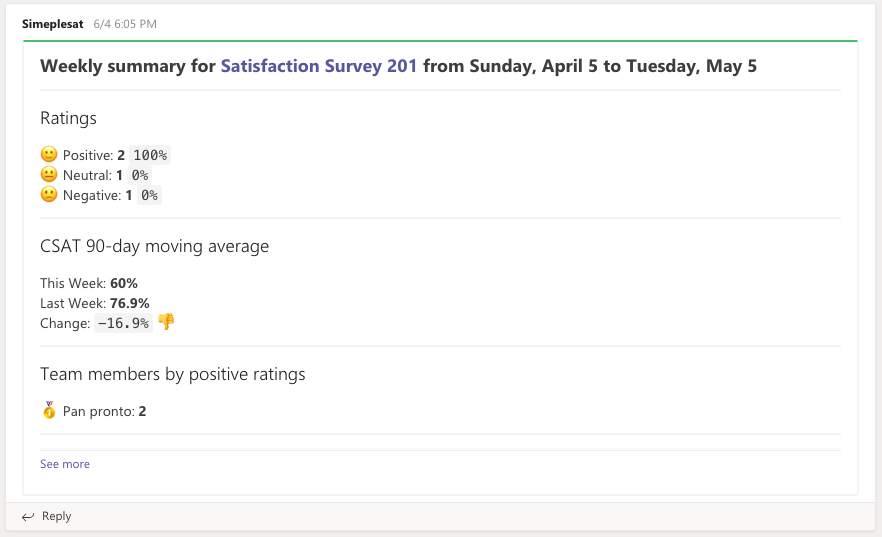
Weekly summaries are sent Monday morning, and monthly on the first of the month.
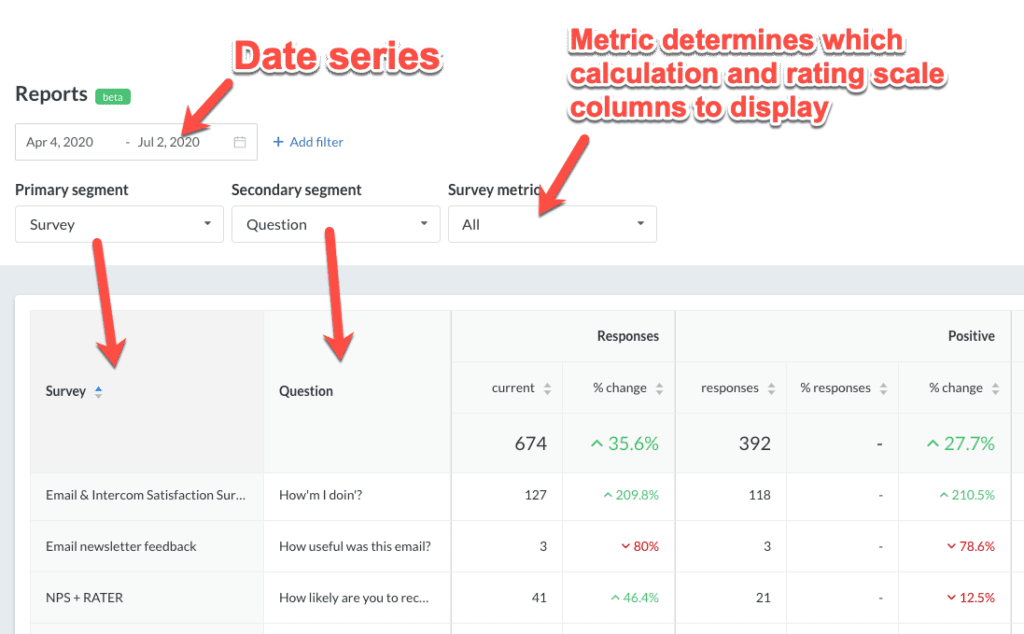
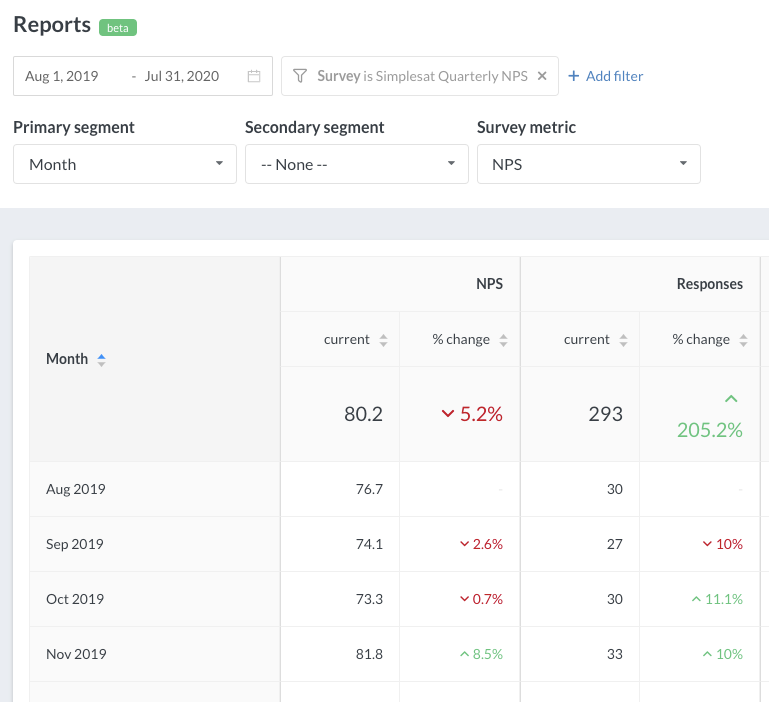
The goal of the new Reports section is to enable you to answer questions you have about your customer satisfaction data faster and easier.
For example, you can answer questions such as:
Which companies have 75% or lower CSAT score?
Which of our team members has the most 5-score ratings?
What does my NPS score look like quarter over quarter?
What’s the positive/neutral/negative breakdown of my feedback based on tags?
Reports are still in beta, but ready for you to start using. Just head over to the Reports section to check it out.
You can view aggregate stats for a wide variety of segments, such as Company, Customer, Team member, or Month.
The Simplesat Reports dashboard
All of this information is easy to digest directly in the Simplesat dashboard. Or, you can export the report you’re looking at to CSV to continue your analysis in Excel or Google Sheets.
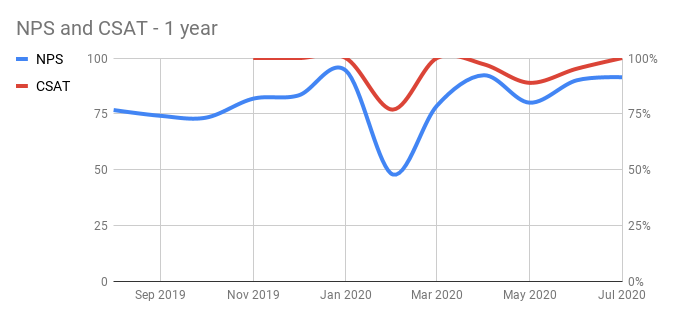
For example, here’s a chart created in Google Sheets comparing NPS and CSAT scores over a year.
This chart in Google Sheets started from a Simplesat reporting export
This data was generated by combining two report exports. One filters results from and NPS survey, while another filters on a different CSAT survey. Both reports include the same time series and use month as the primary segment.
Month over month NPS results
The possibilities are virtually endless. We’d love to hear how you’re using reports, or assist you with any questions or help you need.
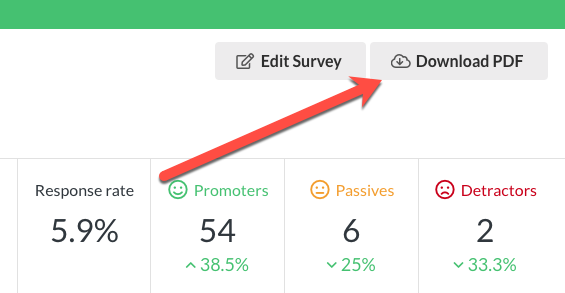
Exporting survey insight results to PDF makes it easy to share satisfaction data with your clients or team over email, without requiring them to log in to a Simplesat account.
To download, just head over to any survey insights page and request your PDF. The file will contain the same data you see on the page – meaning you can filter by date, customer, company, or team member before you download.
This means you can generate reports for specific clients or teams with just a few clicks.
Download any filtered view directly to PDF
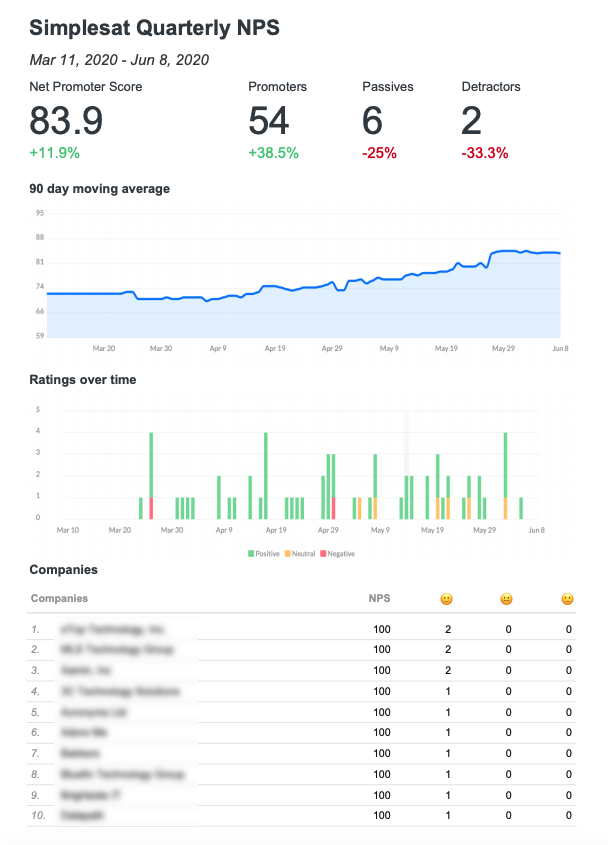
In addition to the survey stats, the report download also includes all feedback details that match the current filters.
On any survey’s insights page, you can download a CSV file of the data behind any table or chart.
Download any chart or table to CSV
This makes it easy for use cases such as getting the full table data for a customer leaderboard, or the numbers behind a chart so you can generate your own graphics in Excel.