Powerful new survey tools, now simpler than ever
Simplesat just made it easier for power users to run dynamic surveys, gain trustworthy data, and get more from every follow-up.
We’ve been busy behind the scenes building sleek and powerful new capabilities. This latest release gives support managers, CX leads, and survey champions the clarity they need to lead with confidence!
No clunky setup. No enterprise consultants. Just smarter surveys, trustworthy data, and features that help you act on feedback.
Let’s take a look at what’s new.
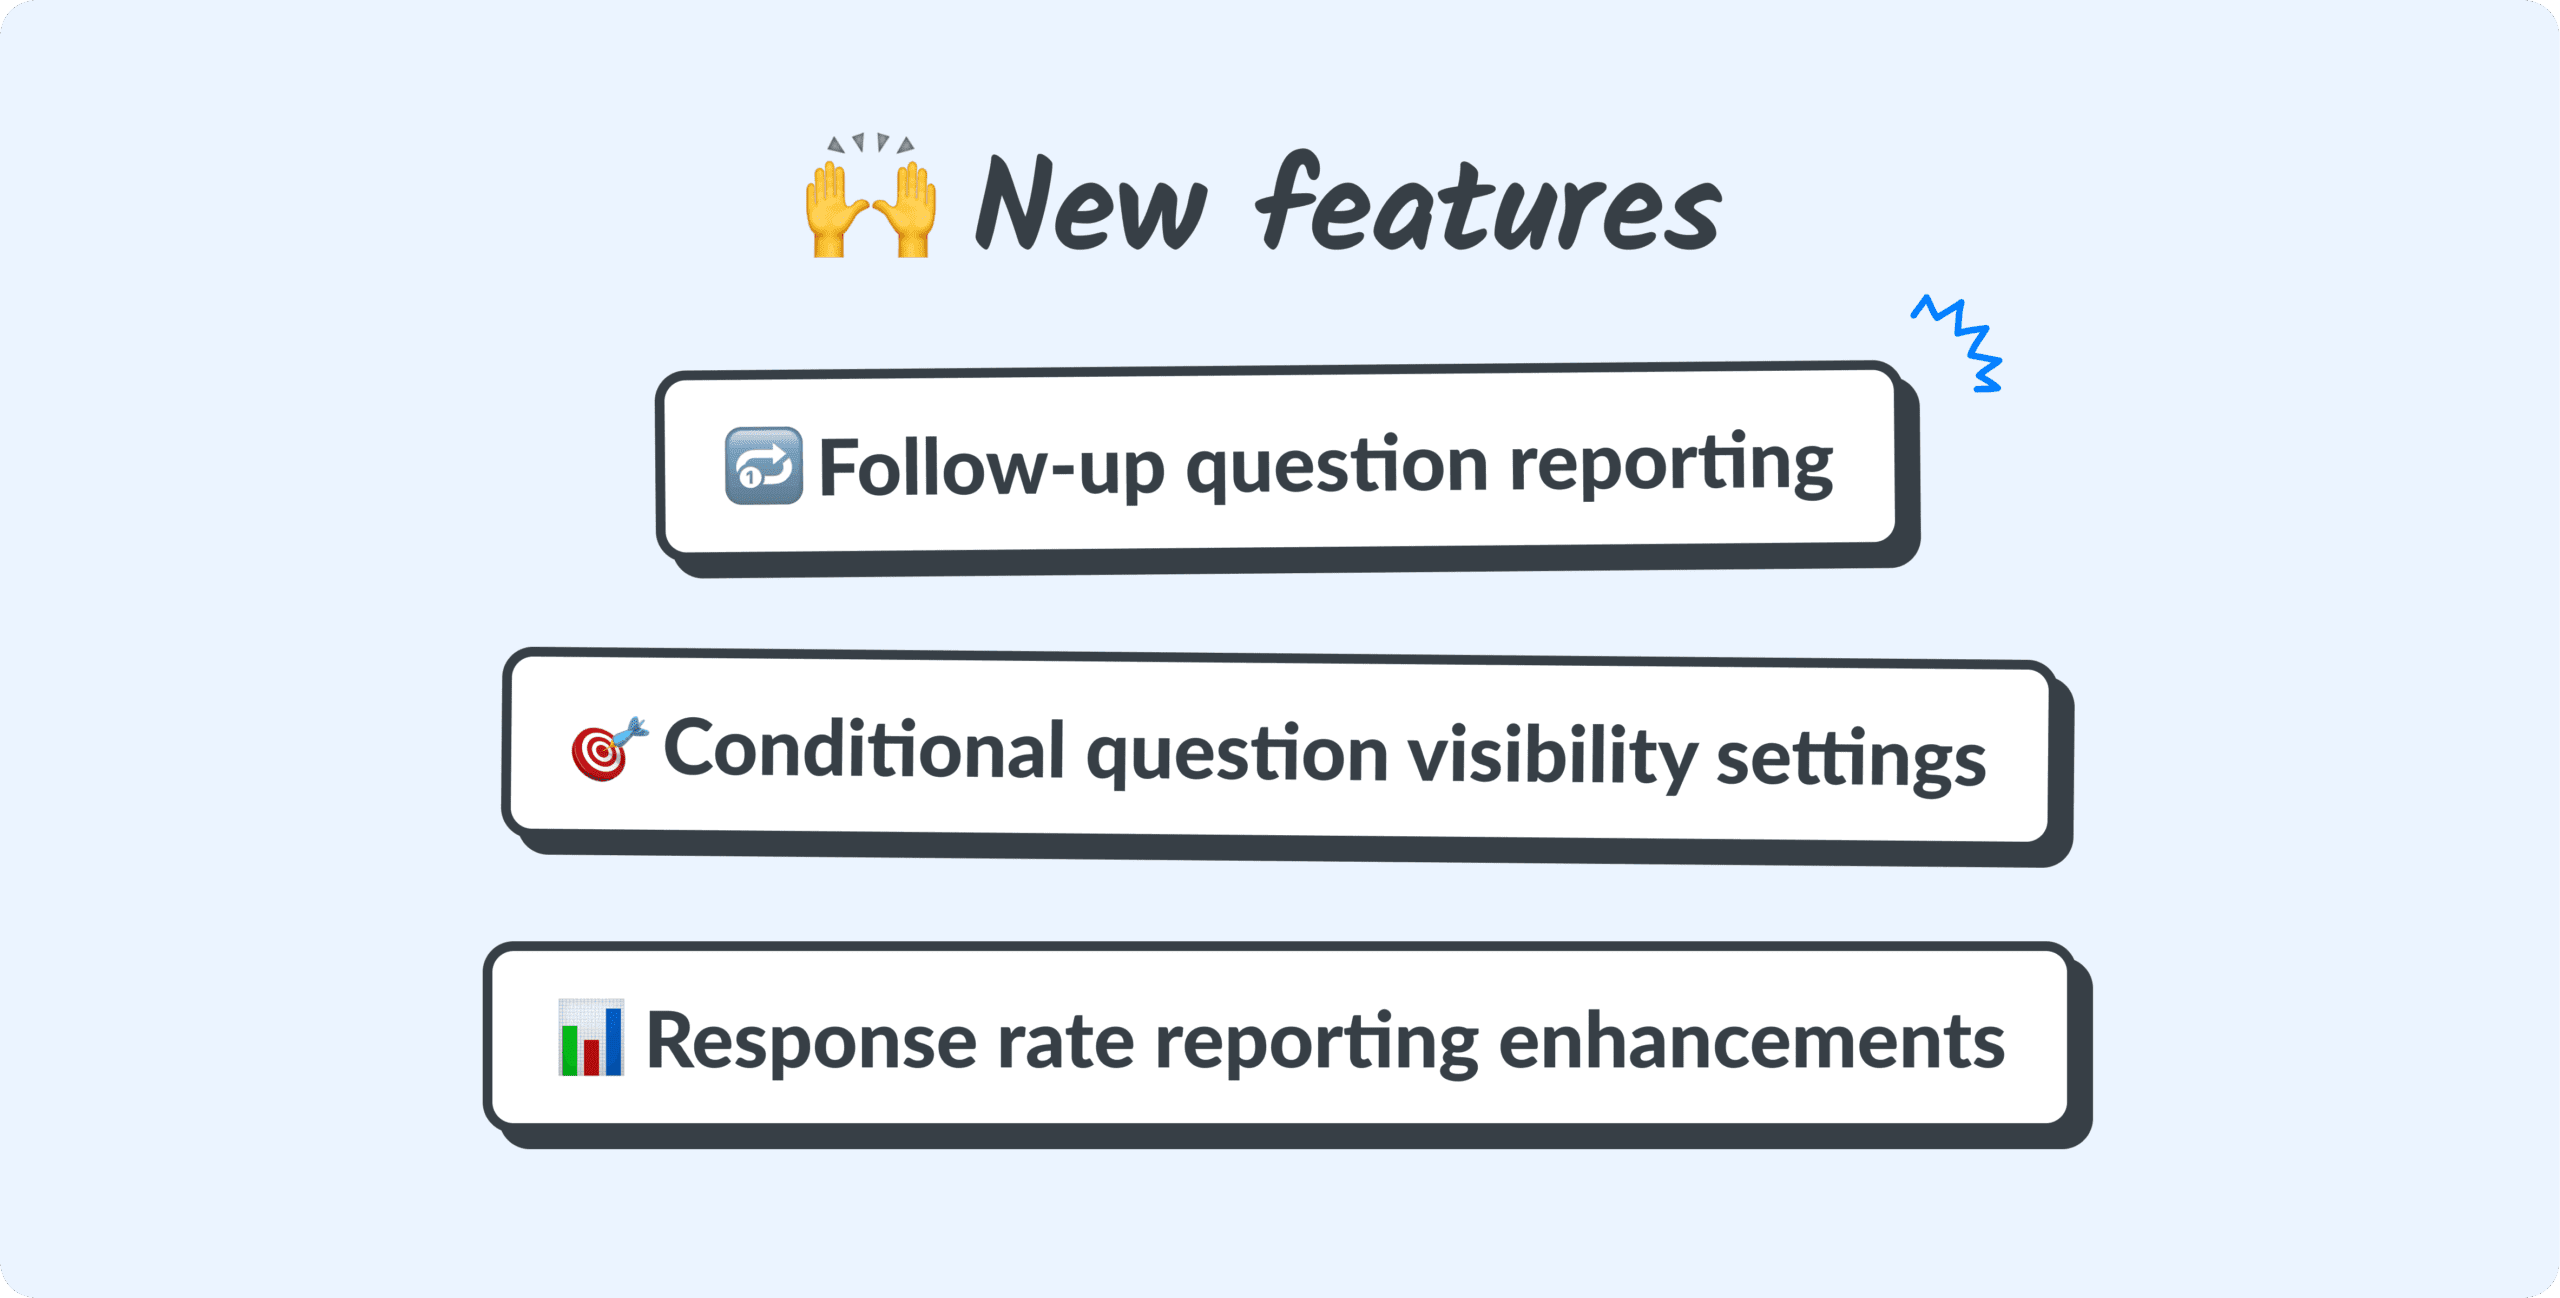
Follow-up question reporting
You asked, we delivered.
Follow-up questions are now fully reportable in Simplesat!
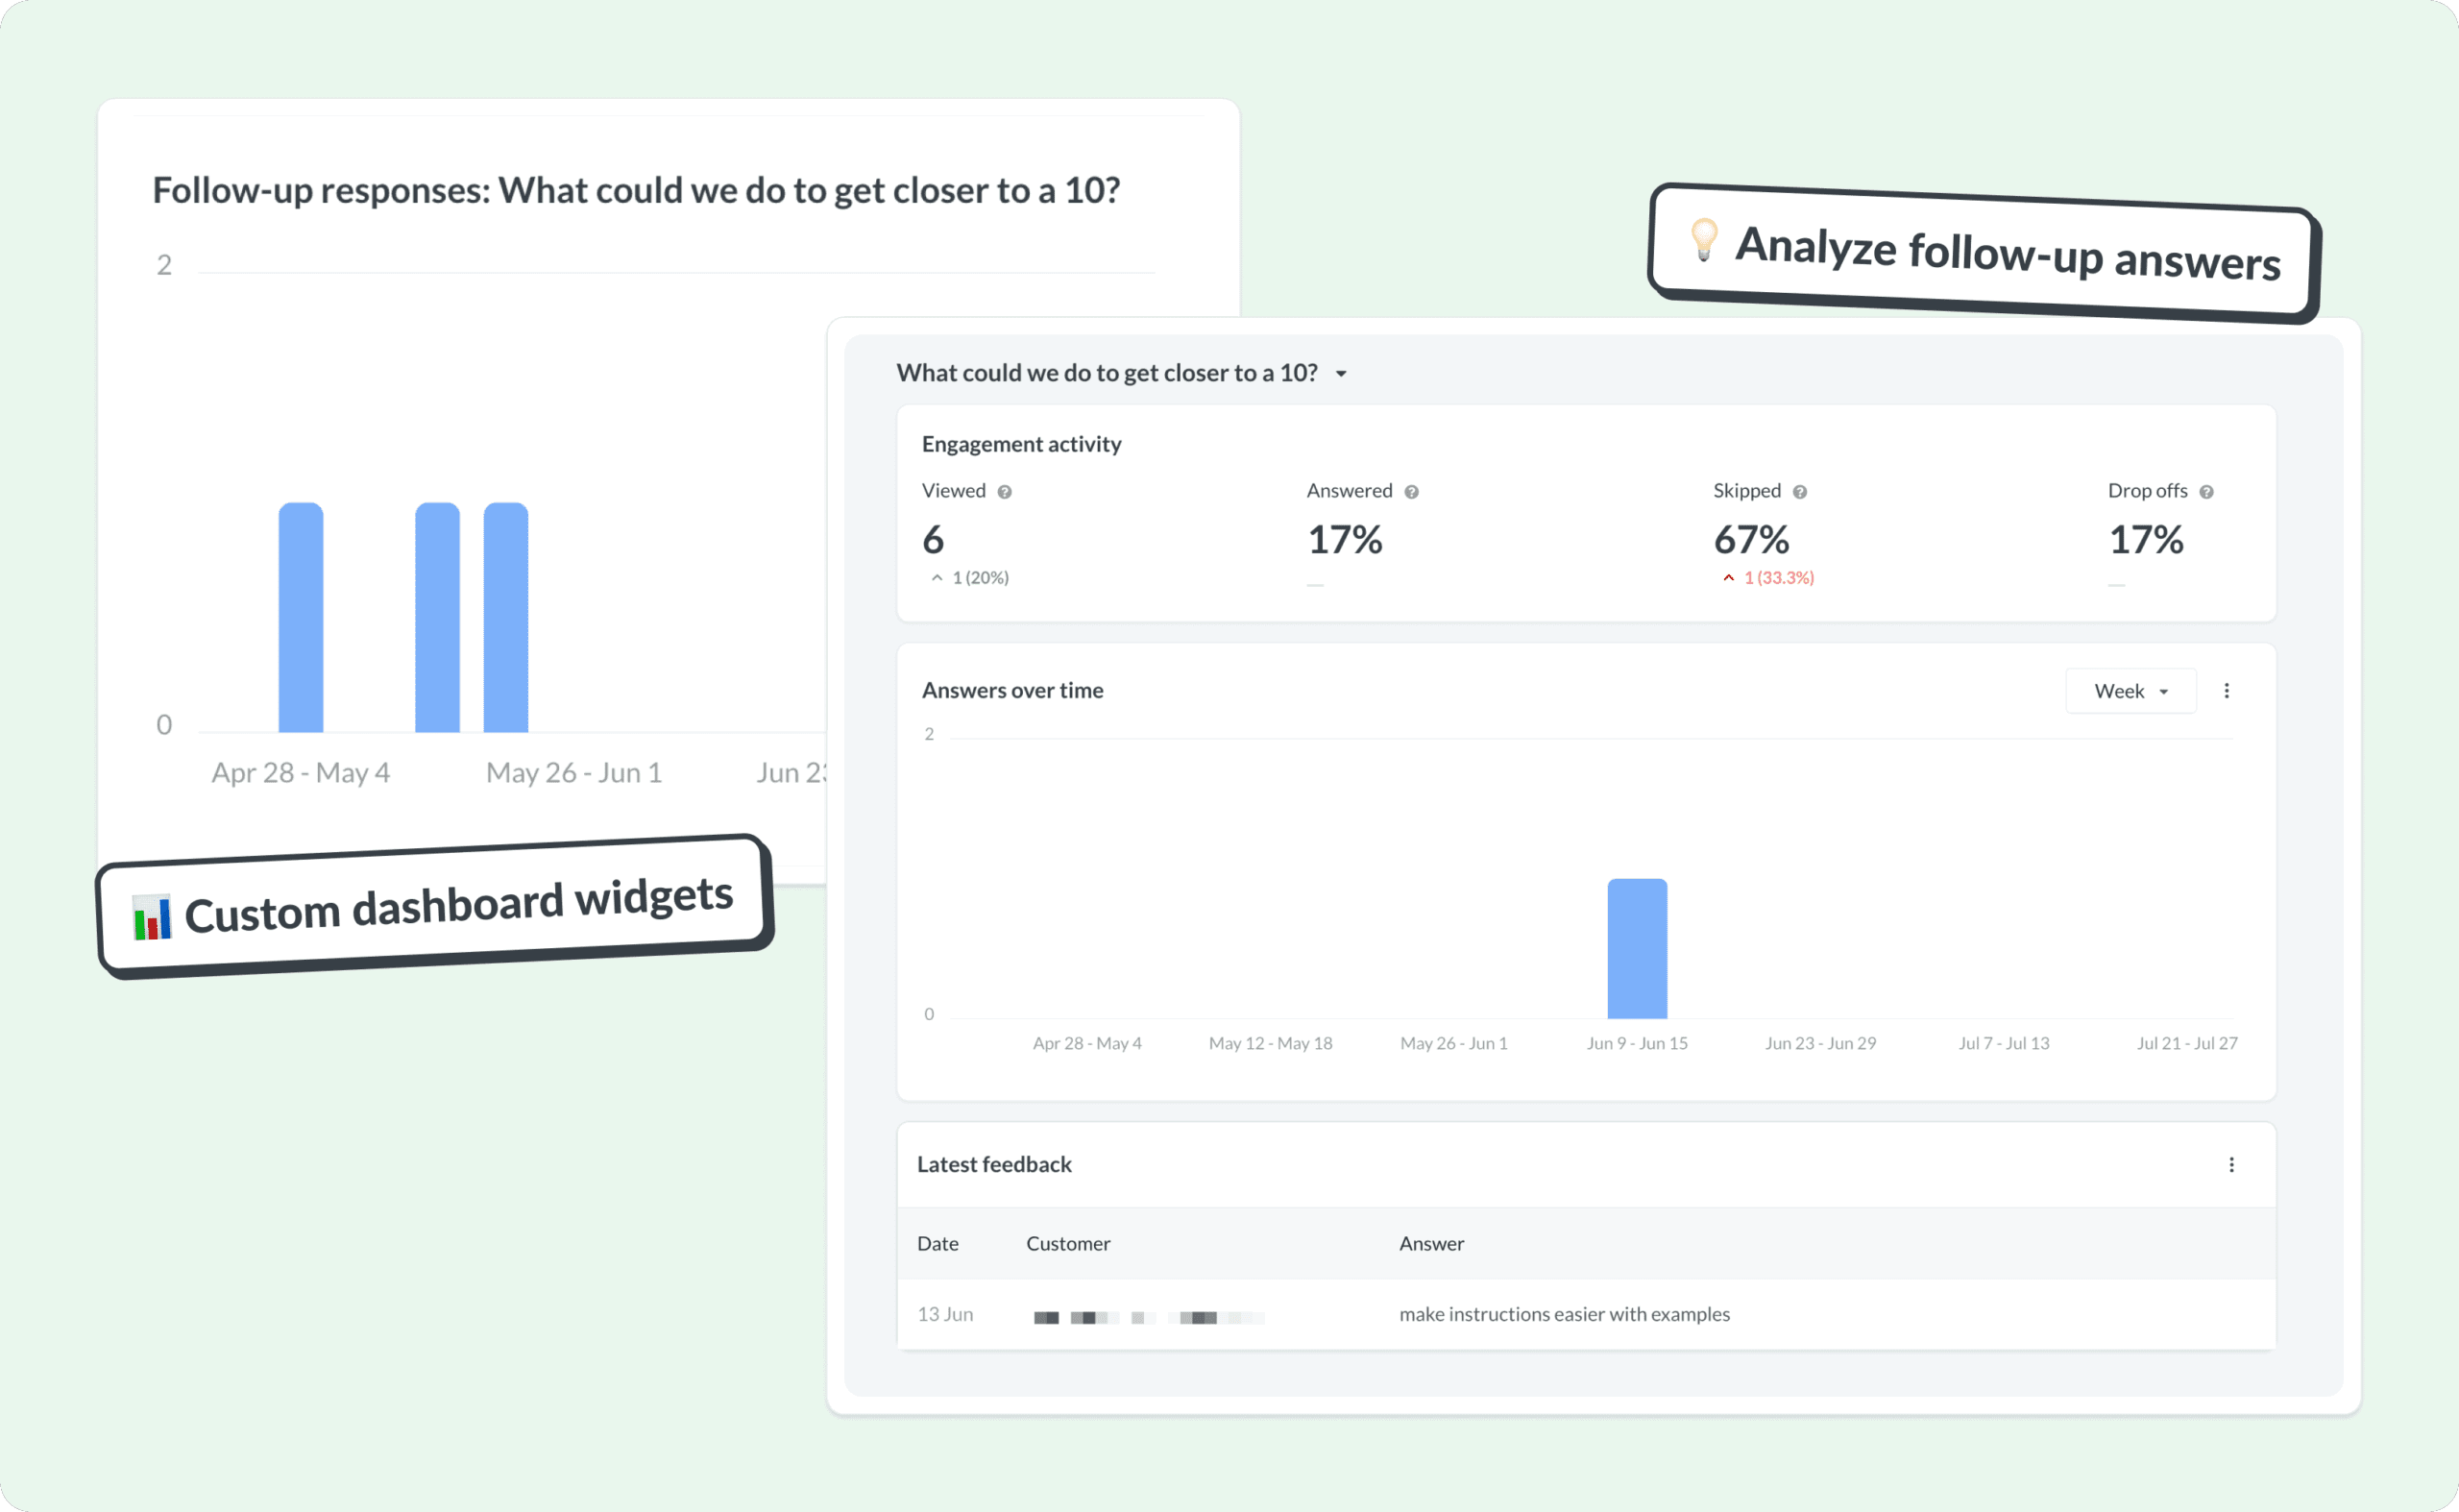
That means every “Why did you give this rating?” or “What could we have done better?” answer now shows up in your dashboards, reports, and widgets.
Follow-up questions now have their own dashboards; they can be used in reports and custom widgets.
Why it matters
🕵️♀️ No more guessing
Understand the why behind every score with full visibility into open-ended responses. Spot trends, dig into pain points, and capture what your customers are really trying to say, without needing to export raw data.
📊 Full reporting visibility
Follow-up questions are treated just like primary questions in all dashboards and widgets. Filter, segment, and visualize them with the same ease! You can now build custom views that tell the full story.
🚀 Enterprise-level analytics
This feature helps position Simplesat alongside top-tier CX platforms, giving your team the tools to uncover deeper insights and present customer feedback with confidence. As always, we’re keeping it bloat-free and affordable.
Analyze follow-up answers
- In any Survey dashboard, open the Questions dropdown and select a follow-up question (indicated by the ↳ icon).
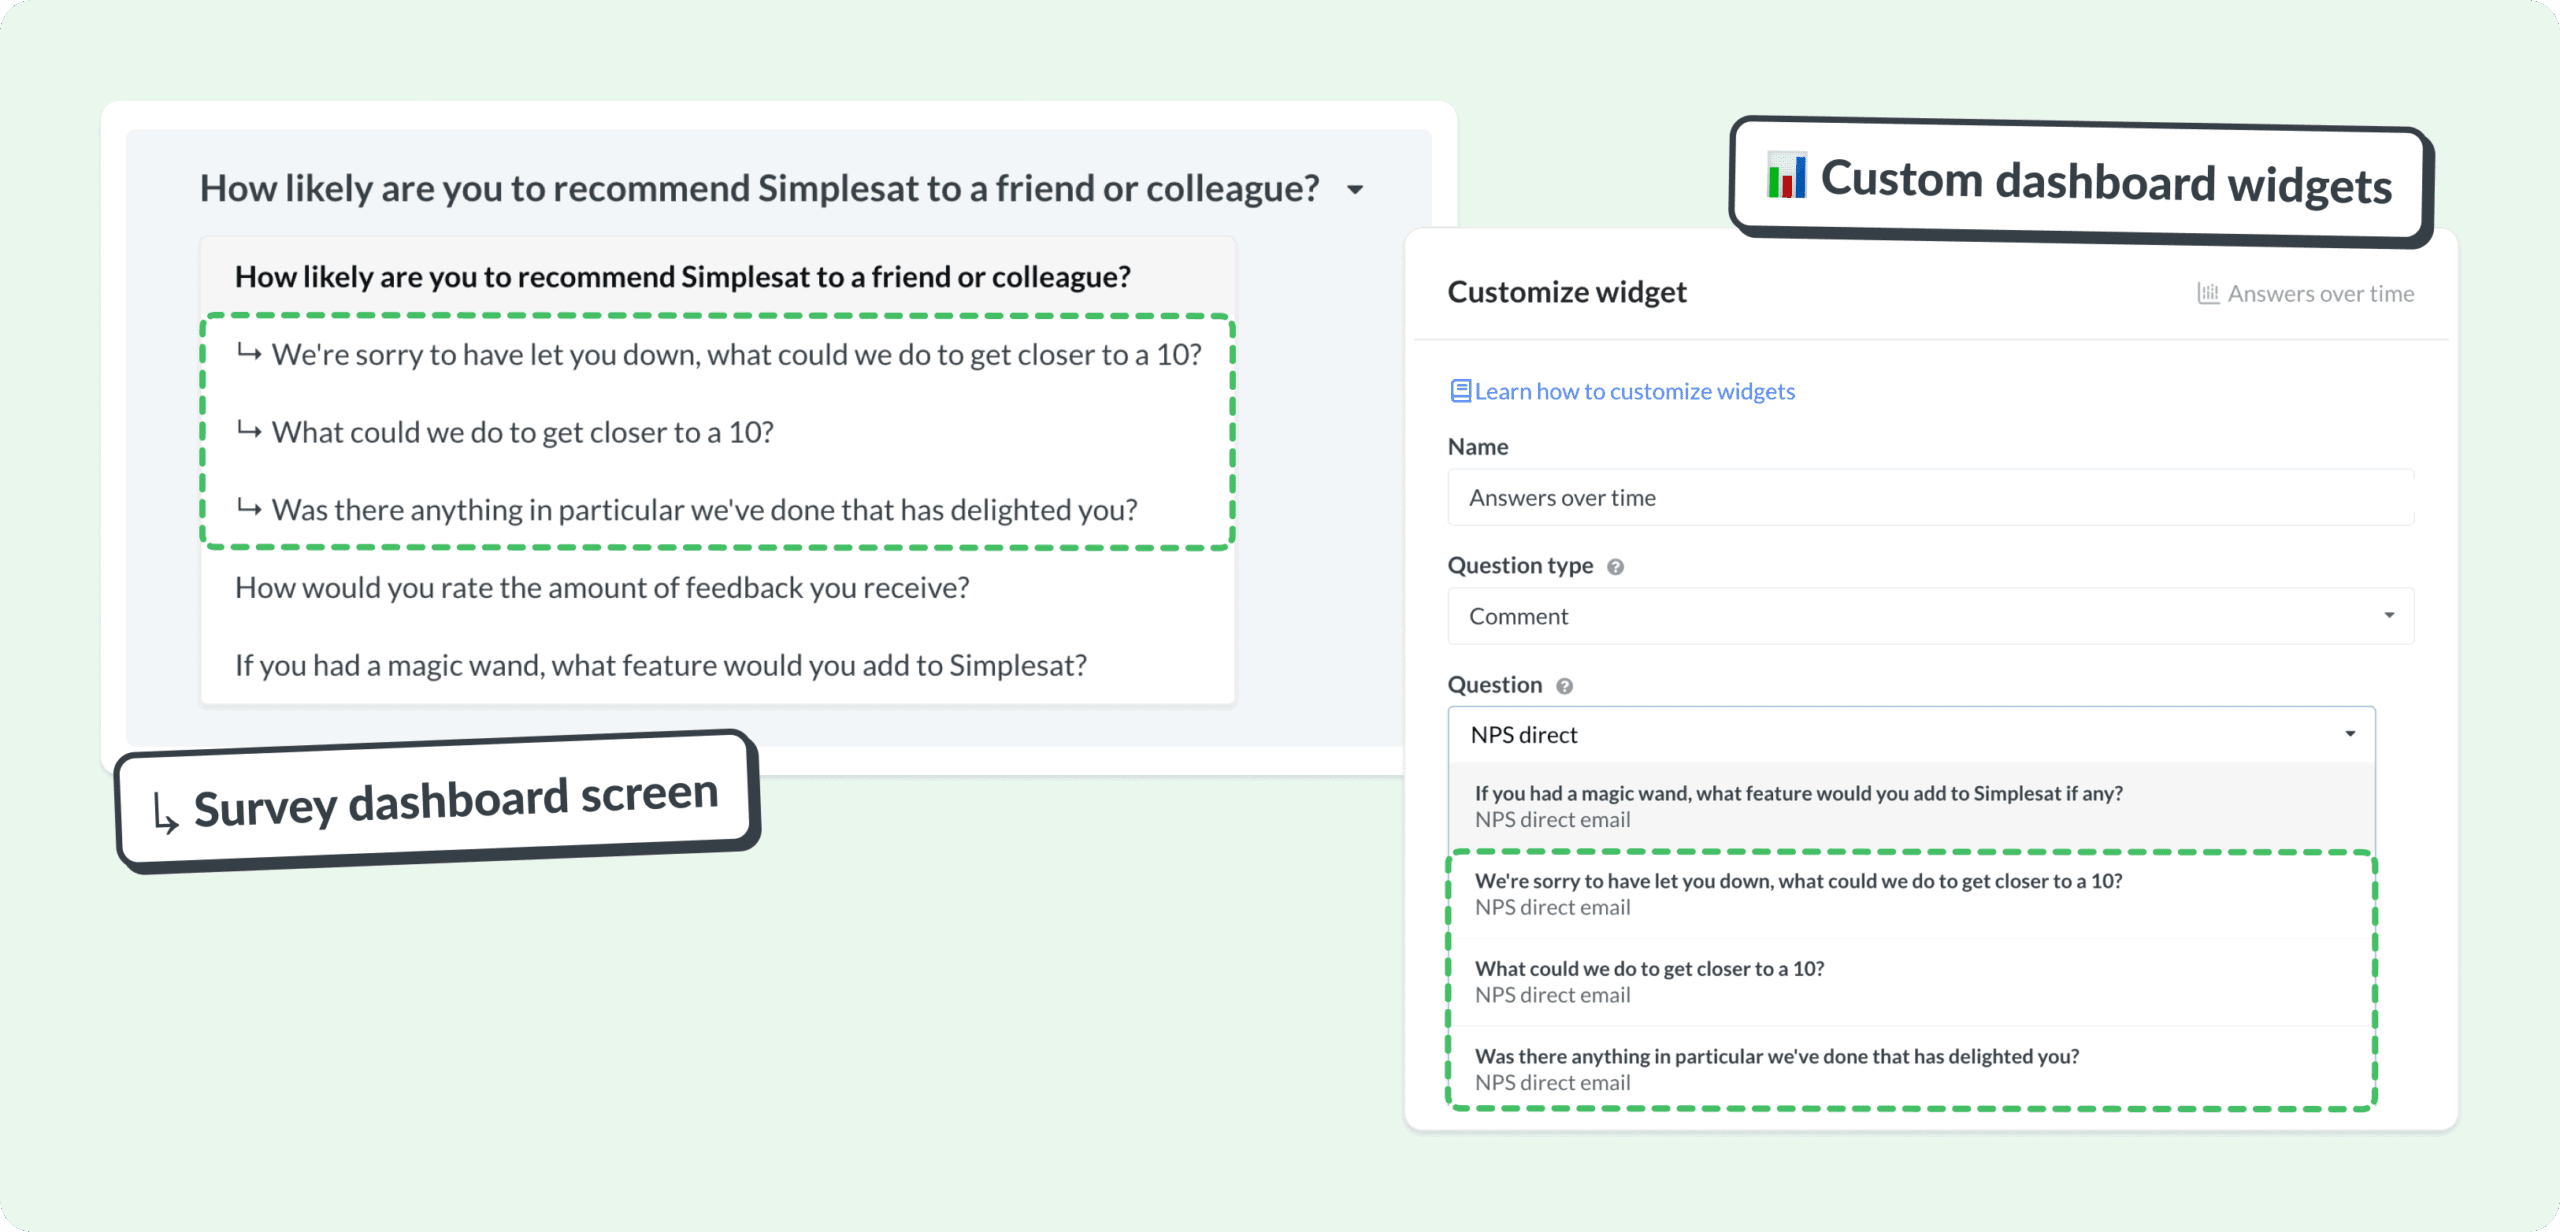
- In Custom dashboard widgets, choose your survey, then select the follow-up question from the same dropdown.
- The questions in these dropdowns are ordered by:
- Survey (alphabetical)
- Parent questions (order in survey)
- Follow-up questions (by question ID)
- The questions in these dropdowns are ordered by:
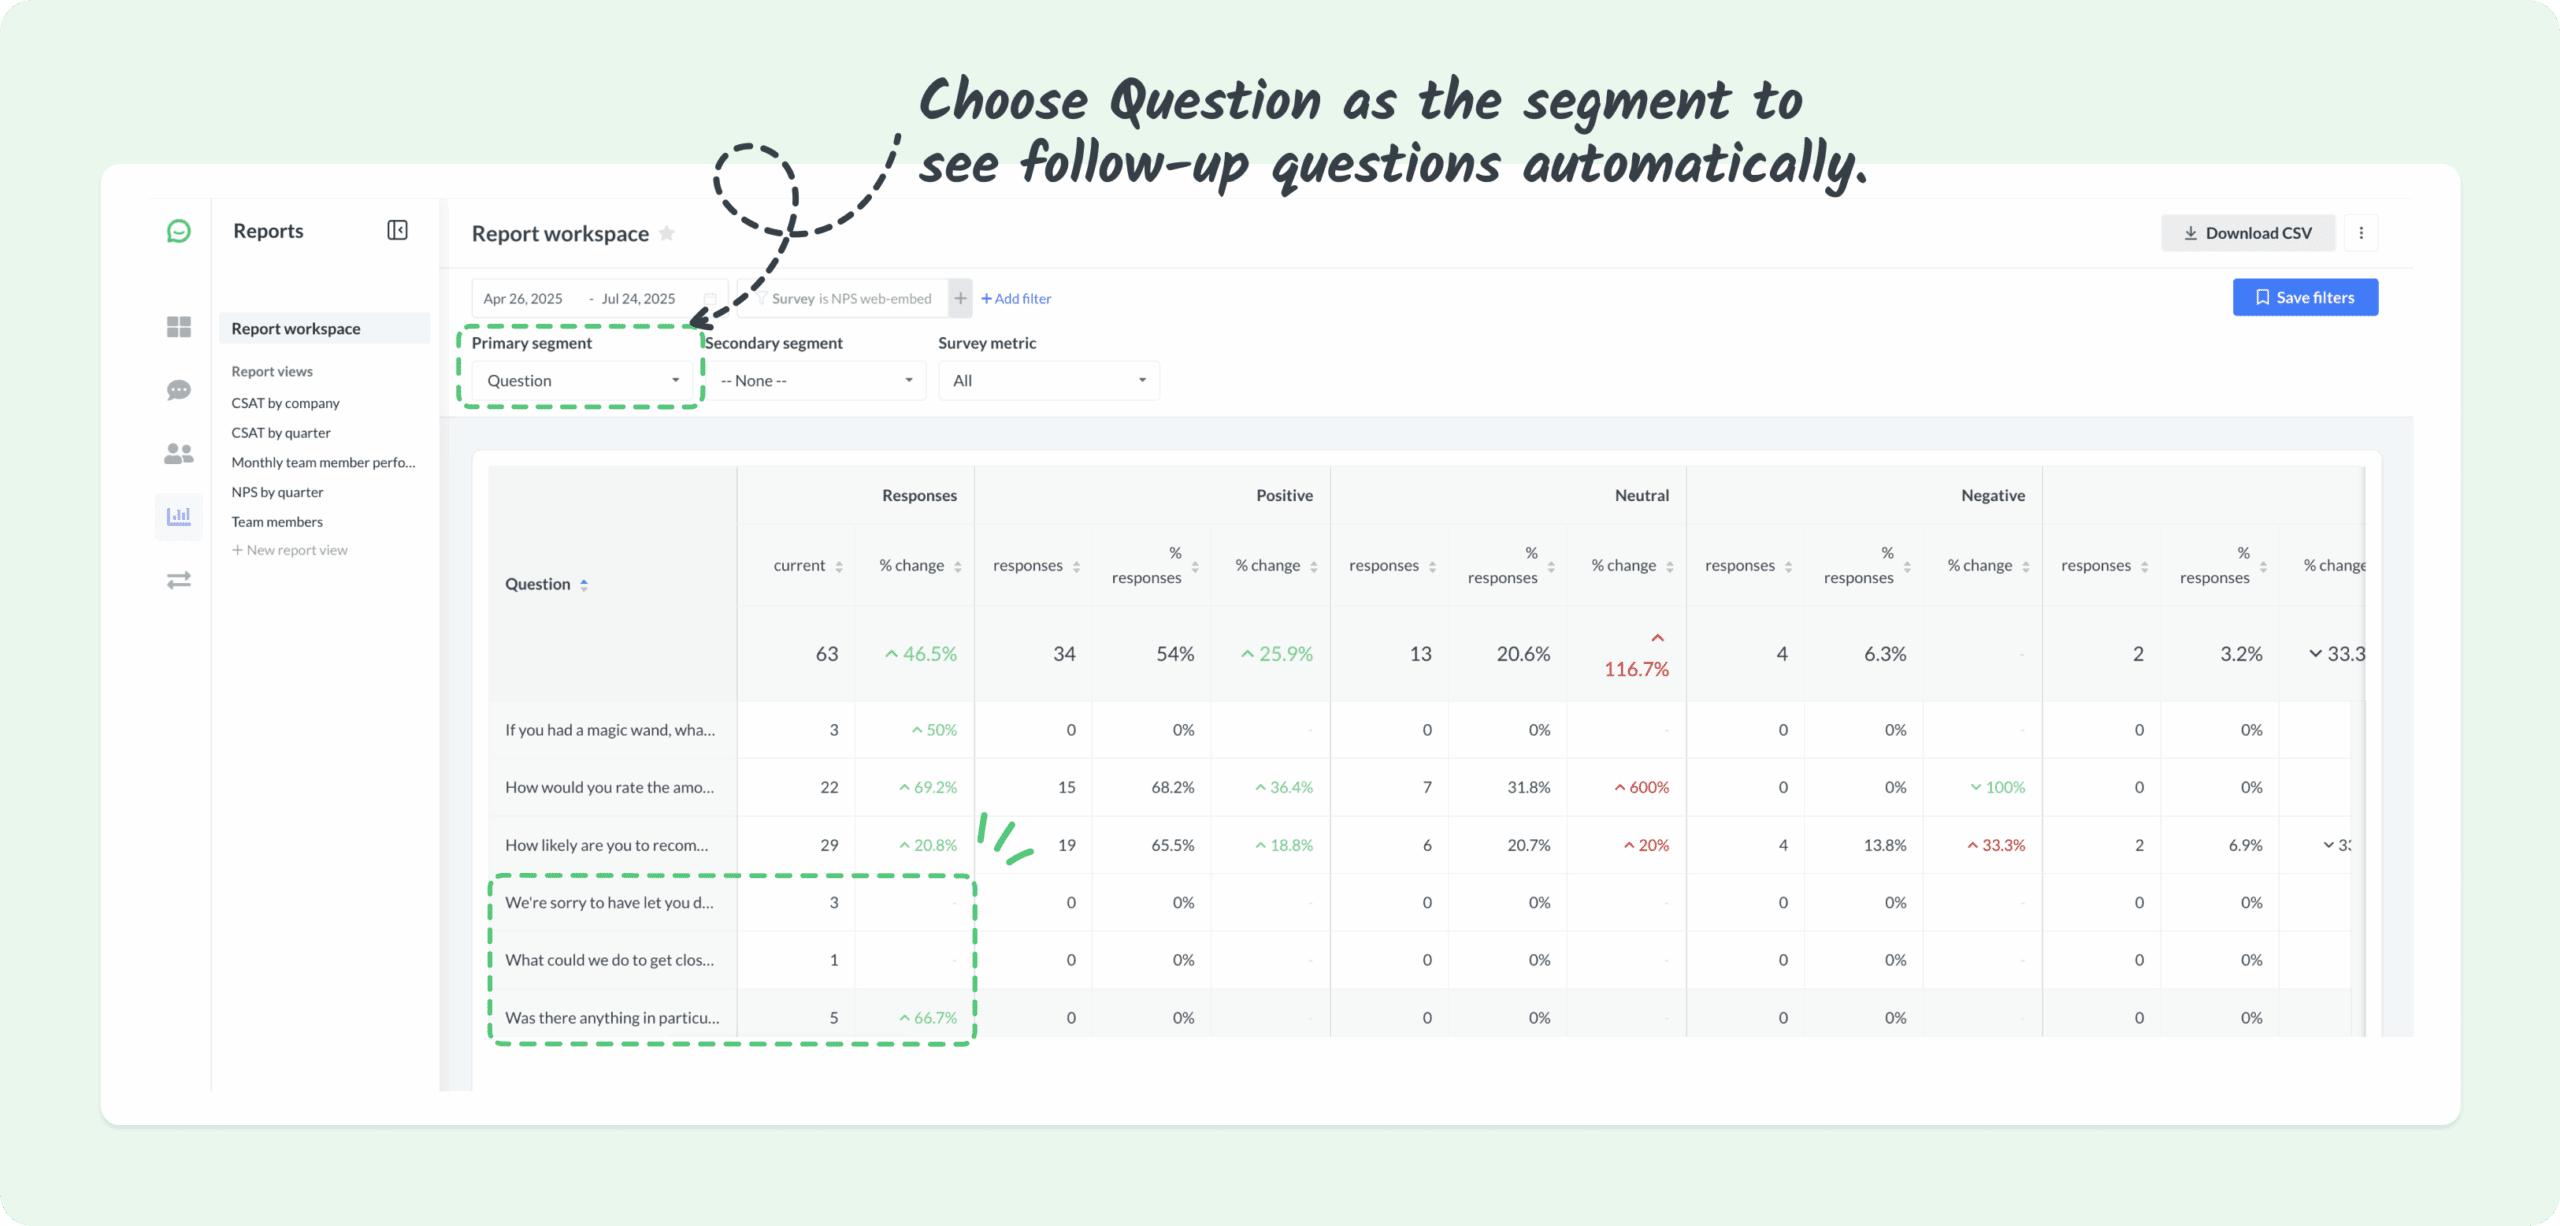
- In the Reports section, choose Question as the segment — follow-up questions will appear automatically.
Overview of the update
- Follow-up questions now have a dedicated dashboard view in Survey dashboards.
- In the Reports > Questions segment, follow-up questions are fully visible and filterable.
- The following Custom dashboard widgets now support follow-up questions:
- Answer distribution
- Answers summary
- Answers over time (previously called “Ratings over time”)
- 90-day moving average (now supports multi-select and non-rating scale questions)
- All drilldowns use the upgraded feedback table layout for consistency and clarity.
🔍 Available on all plans.
Explore our in-depth guides to make the most of these features: Survey dashboard → Follow-up question reporting
Conditional question visibility settings
Dynamic branching surveys made simple
💡 "It would be nice to add a follow up question on certain ratings. I would use it to ask if they wanted a manager to contact them; if they say no, then they can submit, but if they say yes it will require them to enter a phone or email to be contacted."
Simplesat surveys just got a lot smarter.
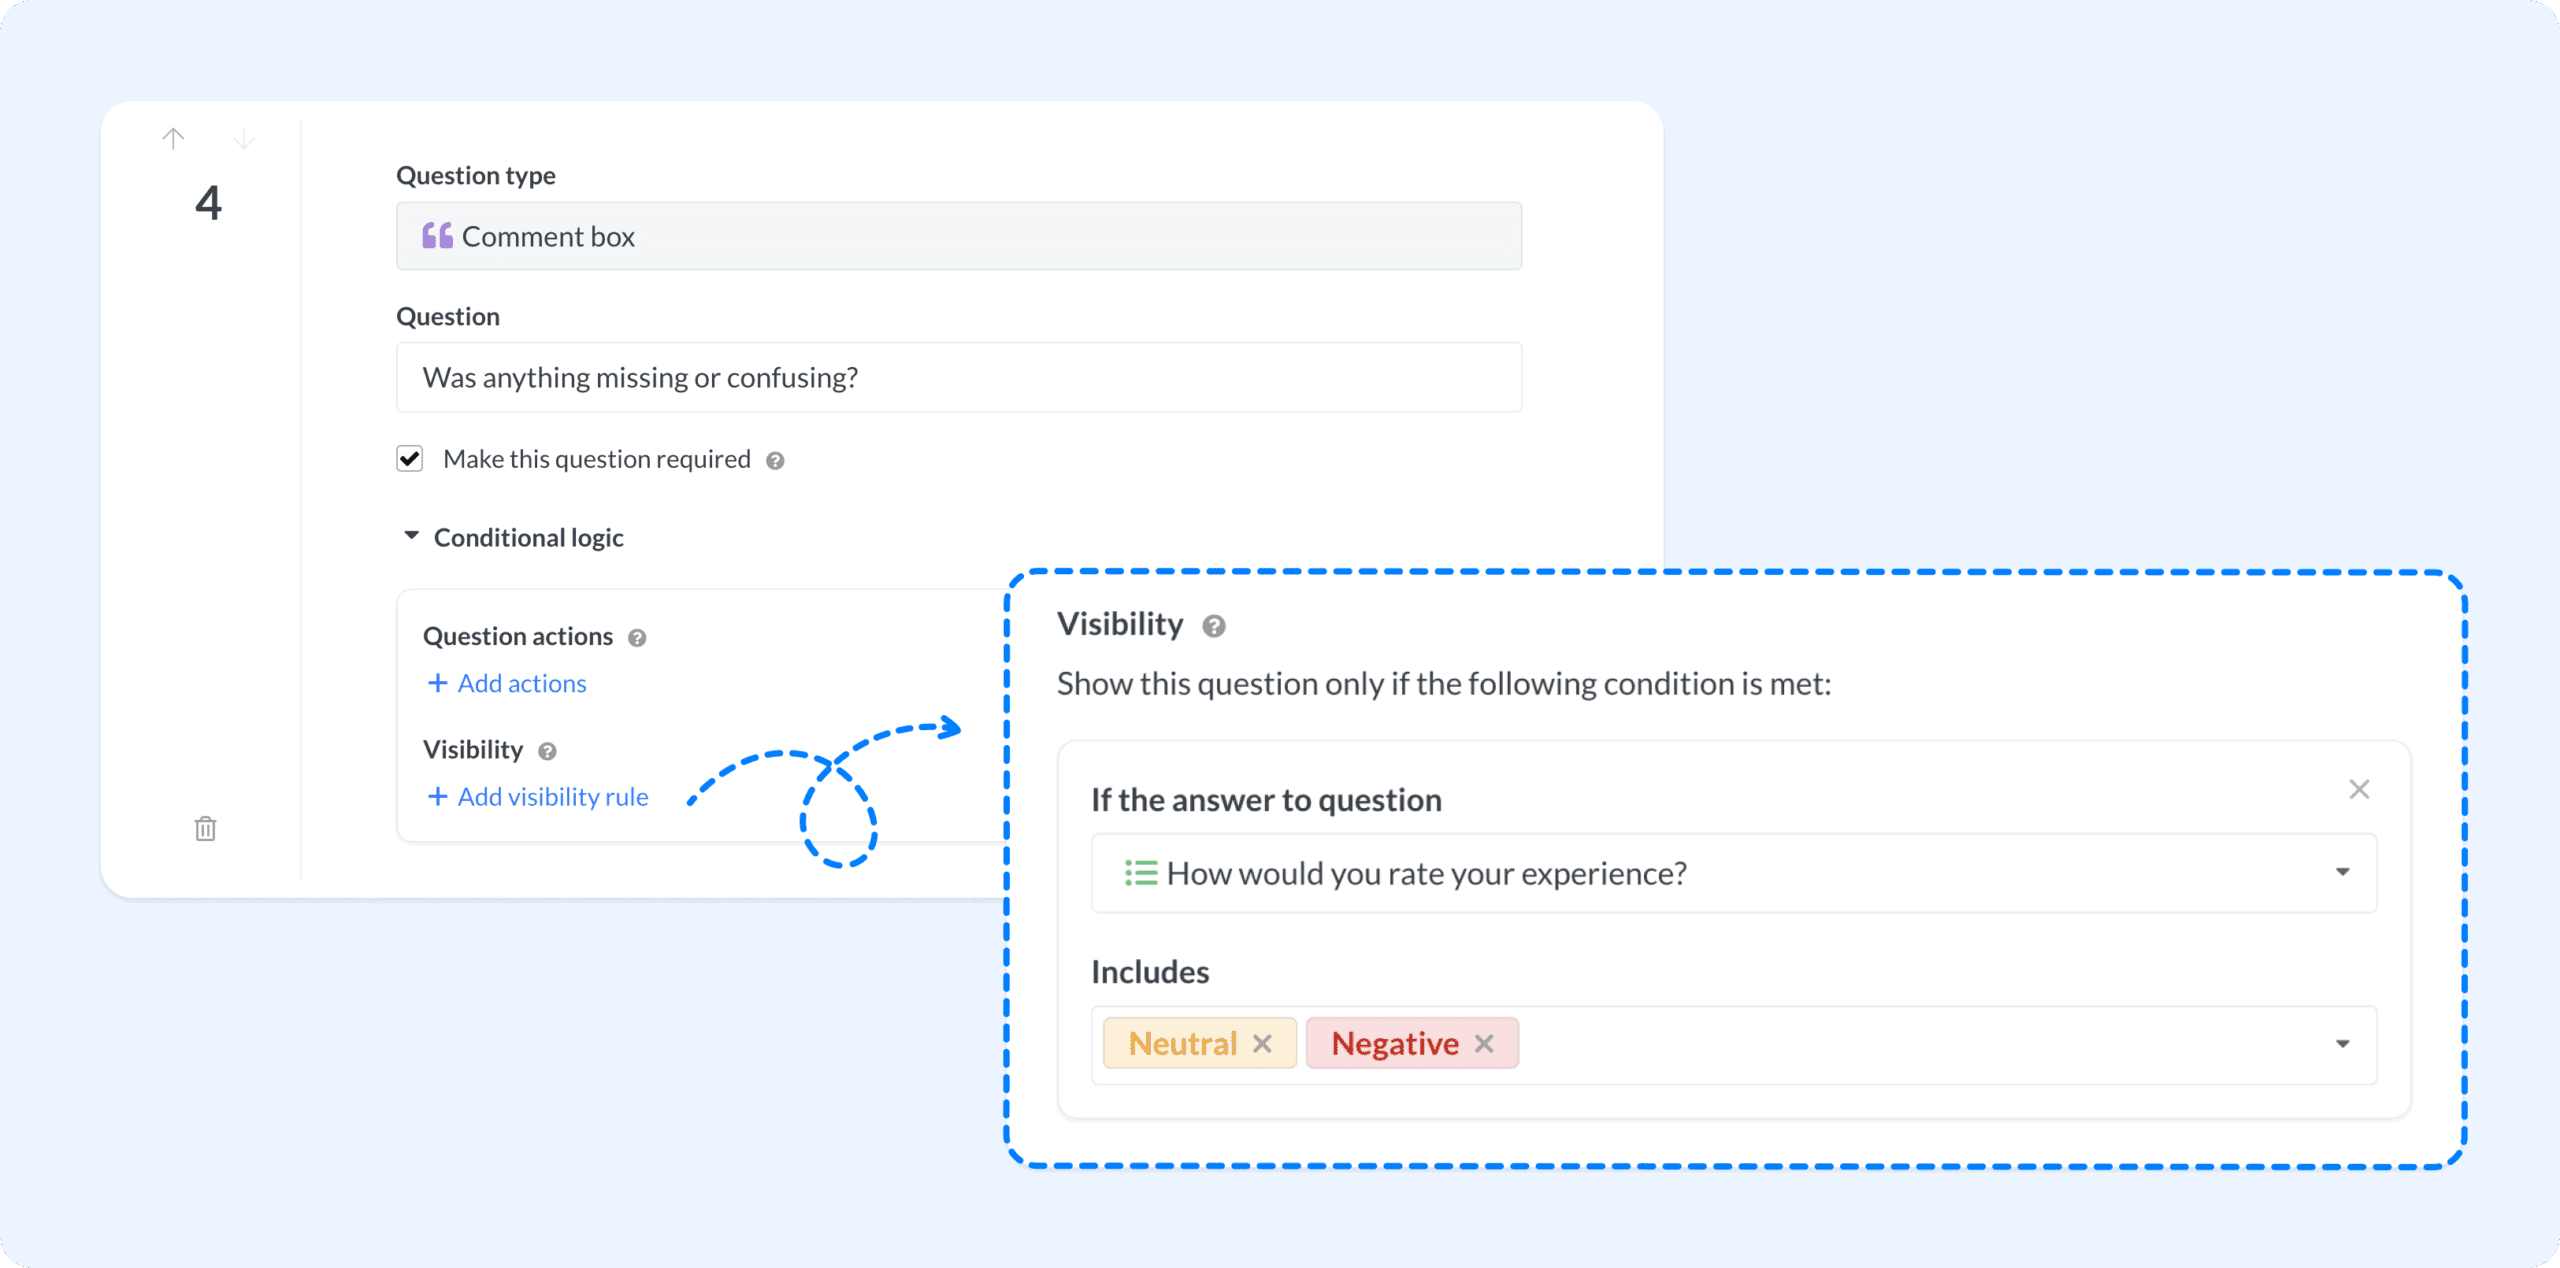
With conditional logic, you can now show or hide any question based on previous answers. It’s perfect for tailoring your surveys without making them longer or more confusing.
Conditional visibility rules let you display questions based on prior answers.
Why it matters
🌱 More insight, less clutter
Show only the questions that matter to each customer, creating a cleaner and more relevant survey experience.
This leads to better-quality answers and less drop-off, especially when handling sensitive or situational feedback.
🔀 Smarter branching
Customize your surveys dynamically! Ask follow-ups only when the customer gives a low score or selects a specific product area. Get more context from unhappy customers and skip irrelevant questions for satisfied ones.
Known limits
- One visibility rule per question (for now).
- Doesn’t work for Intercom surveys yet, but we’re working on it.
🔍 Available on Pro plan and above.
Explore our in-depth guides to make the most of these features: Conditional logic → Conditional question visibility settings
Response rate reporting enhancements
More accurate data = better decisions
💡 "Is there a way I can see a report/graph of our average CSAT each month over July - December 2020? I can see 90 days right now but would like to extend this. And is it possible to see the same for response rates?"
You can’t improve what you can’t measure. That’s why we revamped how Simplesat calculates and displays survey response rates across all delivery methods.
Better tracking, clearer calculations, and powerful new widgets to help you see what’s working & what’s not.
What’s new
Open tracking and calculation
The tracking pixel has been enhanced to encompass all placeholder fields utilized in rating URLs, with the exception of custom attributes.
Our approach to calculating response rates now utilizes a first-open cohort method. This means each response is associated with the initial email open we detect, allowing us to accurately tally the number of emails viewed before a customer replies.
Additionally, we have streamlined our model by unifying Email embed and SendGrid tracking into a single framework, resulting in a cleaner, simpler, and more precise system.
Engagement activity widget
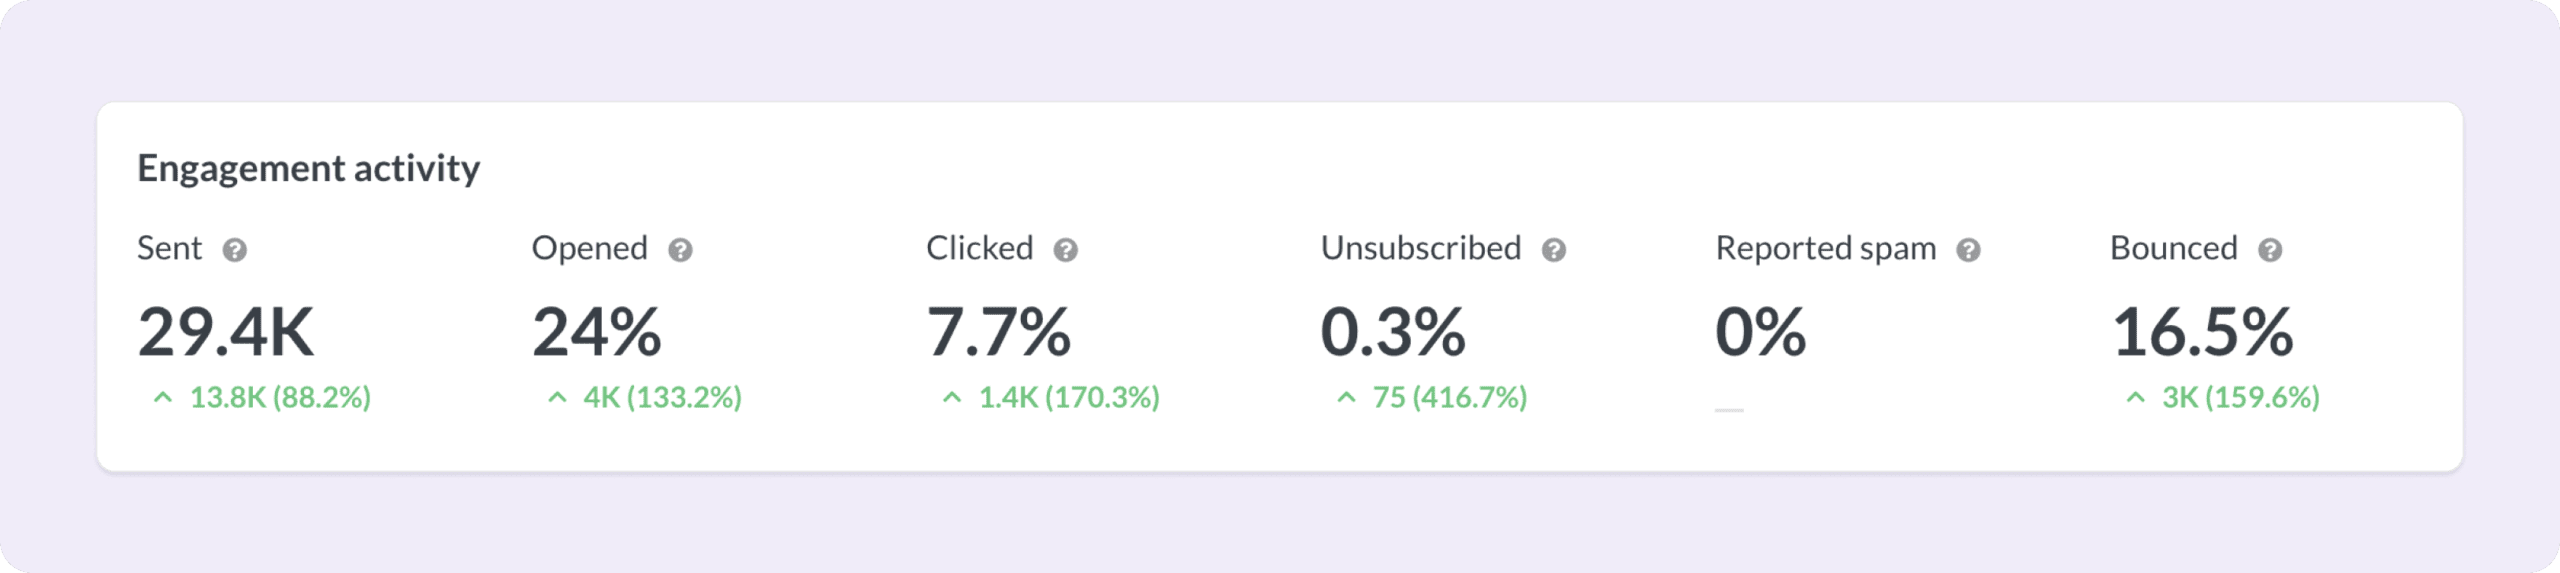
- Direct email surveys now show a Delivered stat (sent minus bounces), and a new Response rate (Responses / Opens) is available for all survey types.
- The Responded stat now shows only the raw number of replies. This separation ensures accurate attribution – via first open – and clearer trends.
Response rates over time widget
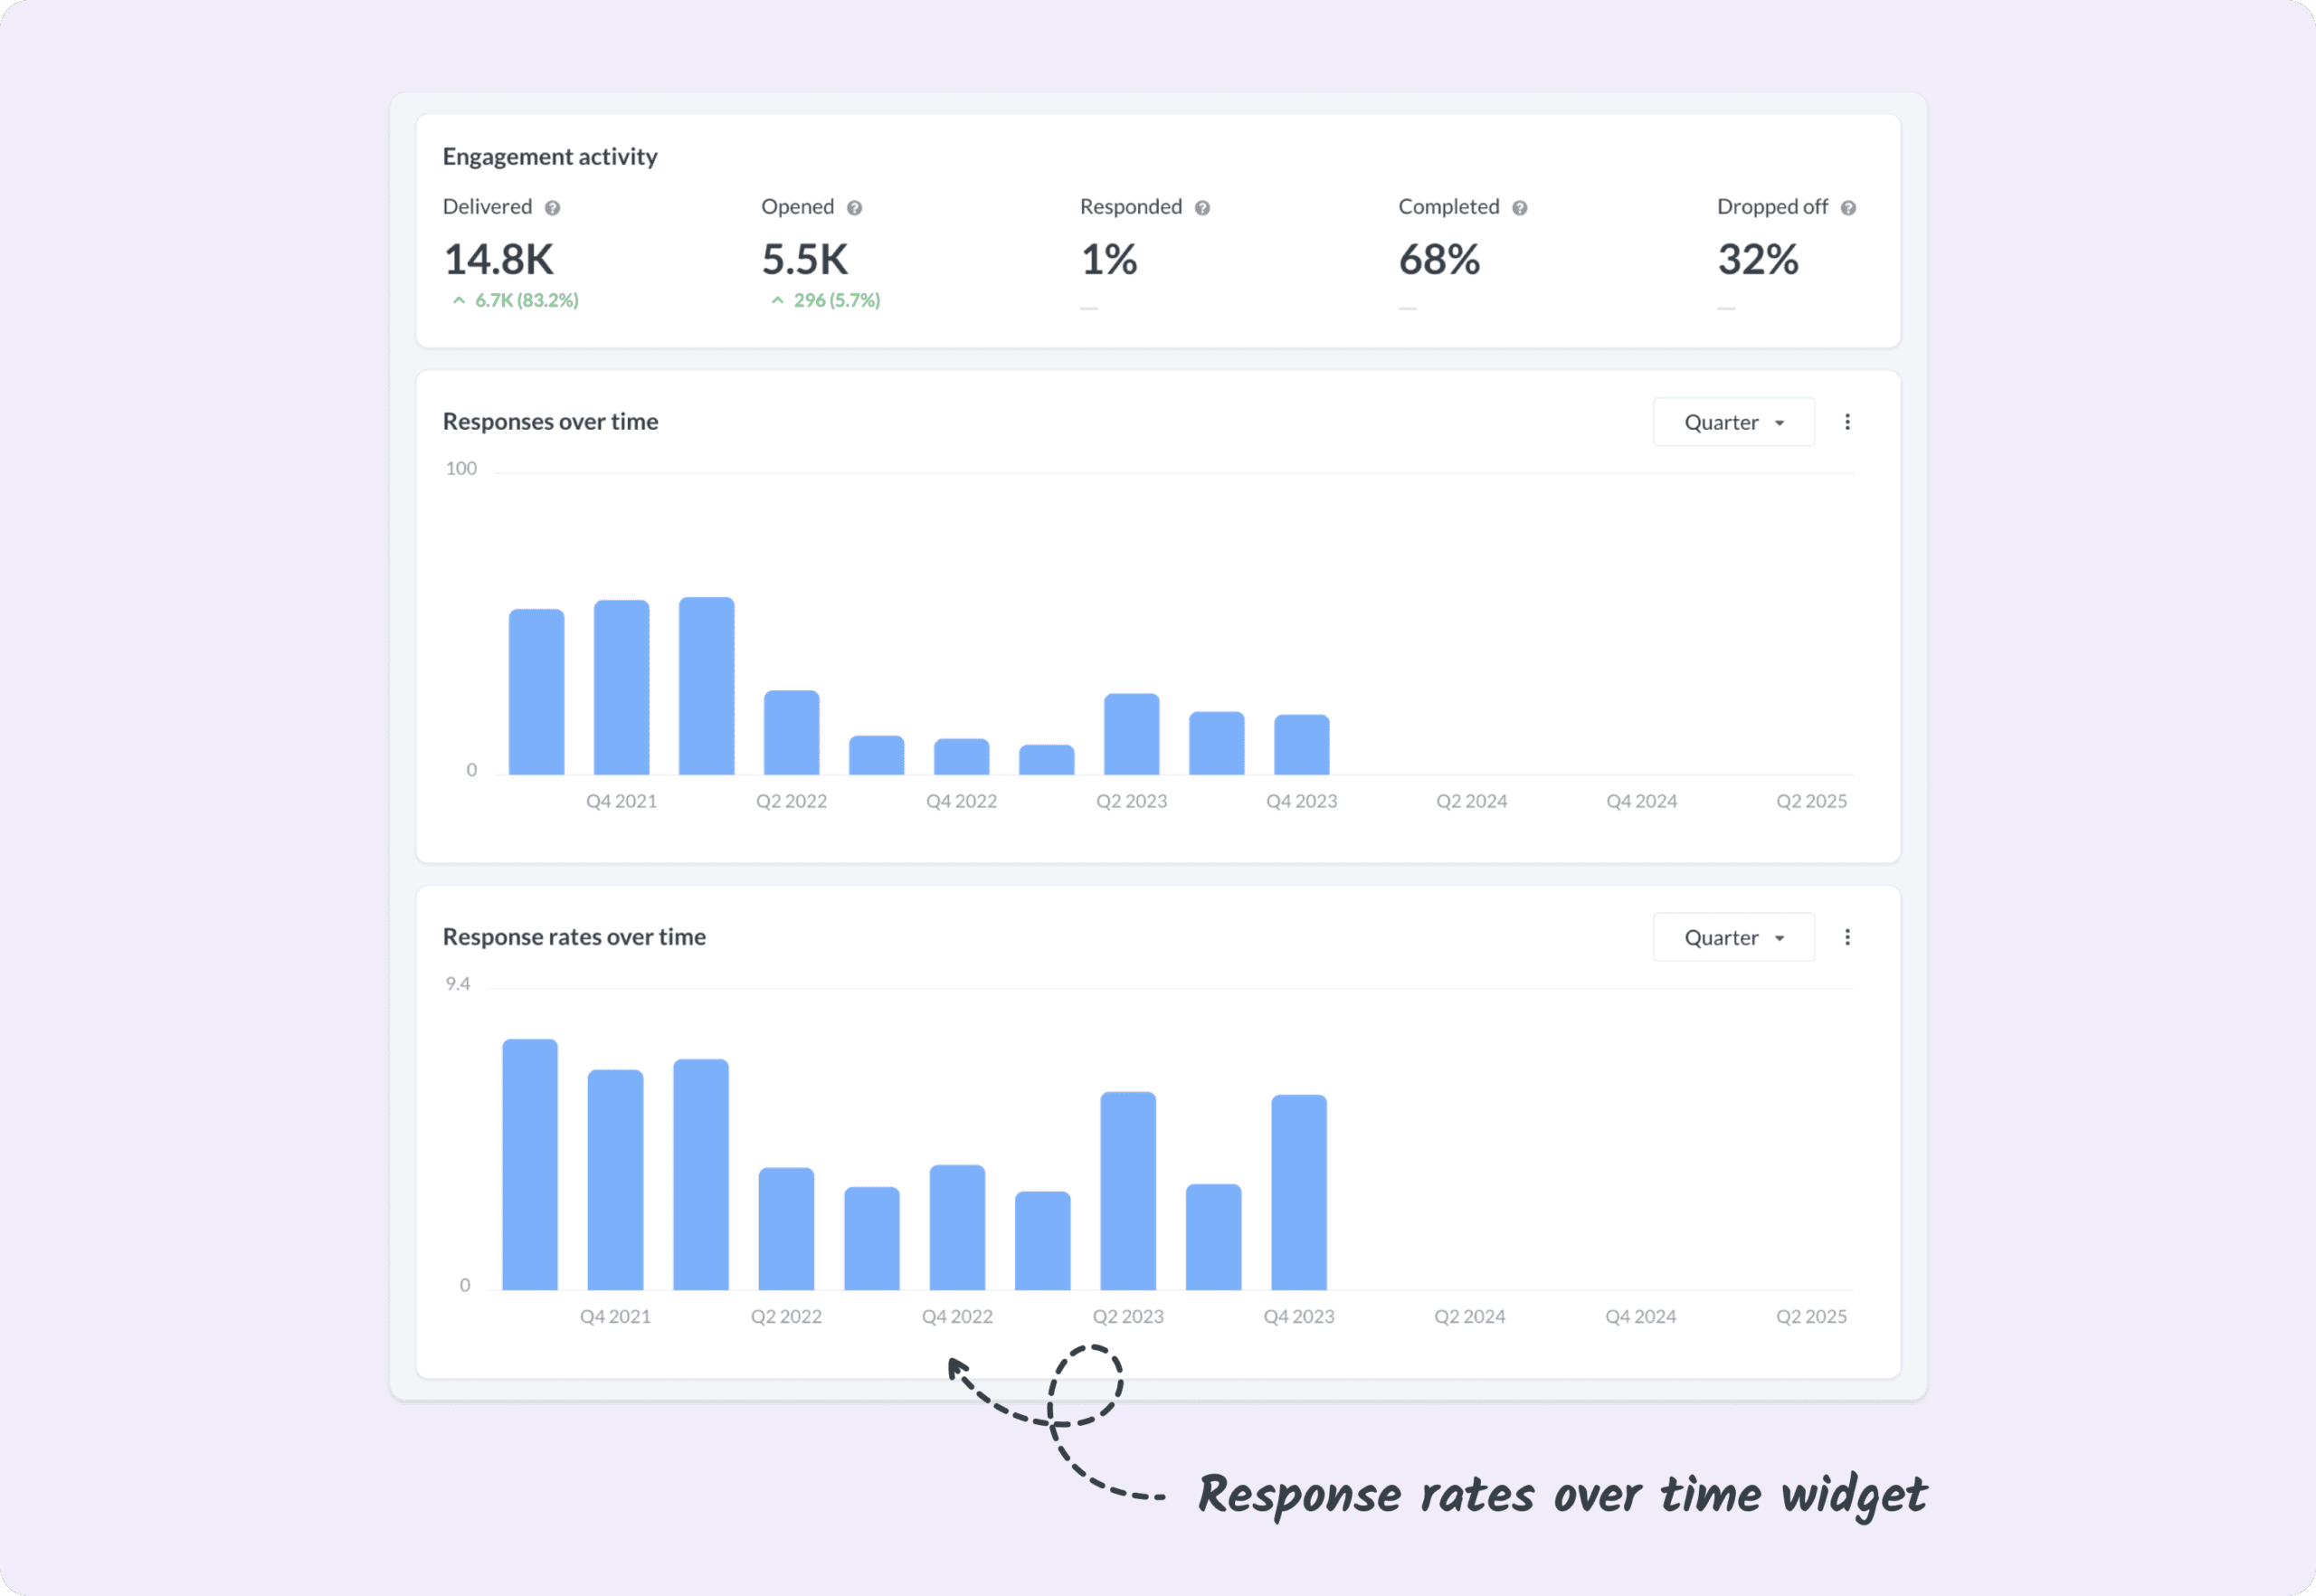
Dashboards now show at-a-glance stats like Delivered, Opened, Responded, and Response Rate. This makes it easier to troubleshoot delivery issues, optimize timing, and compare methods like email embed vs. direct send.
Email events
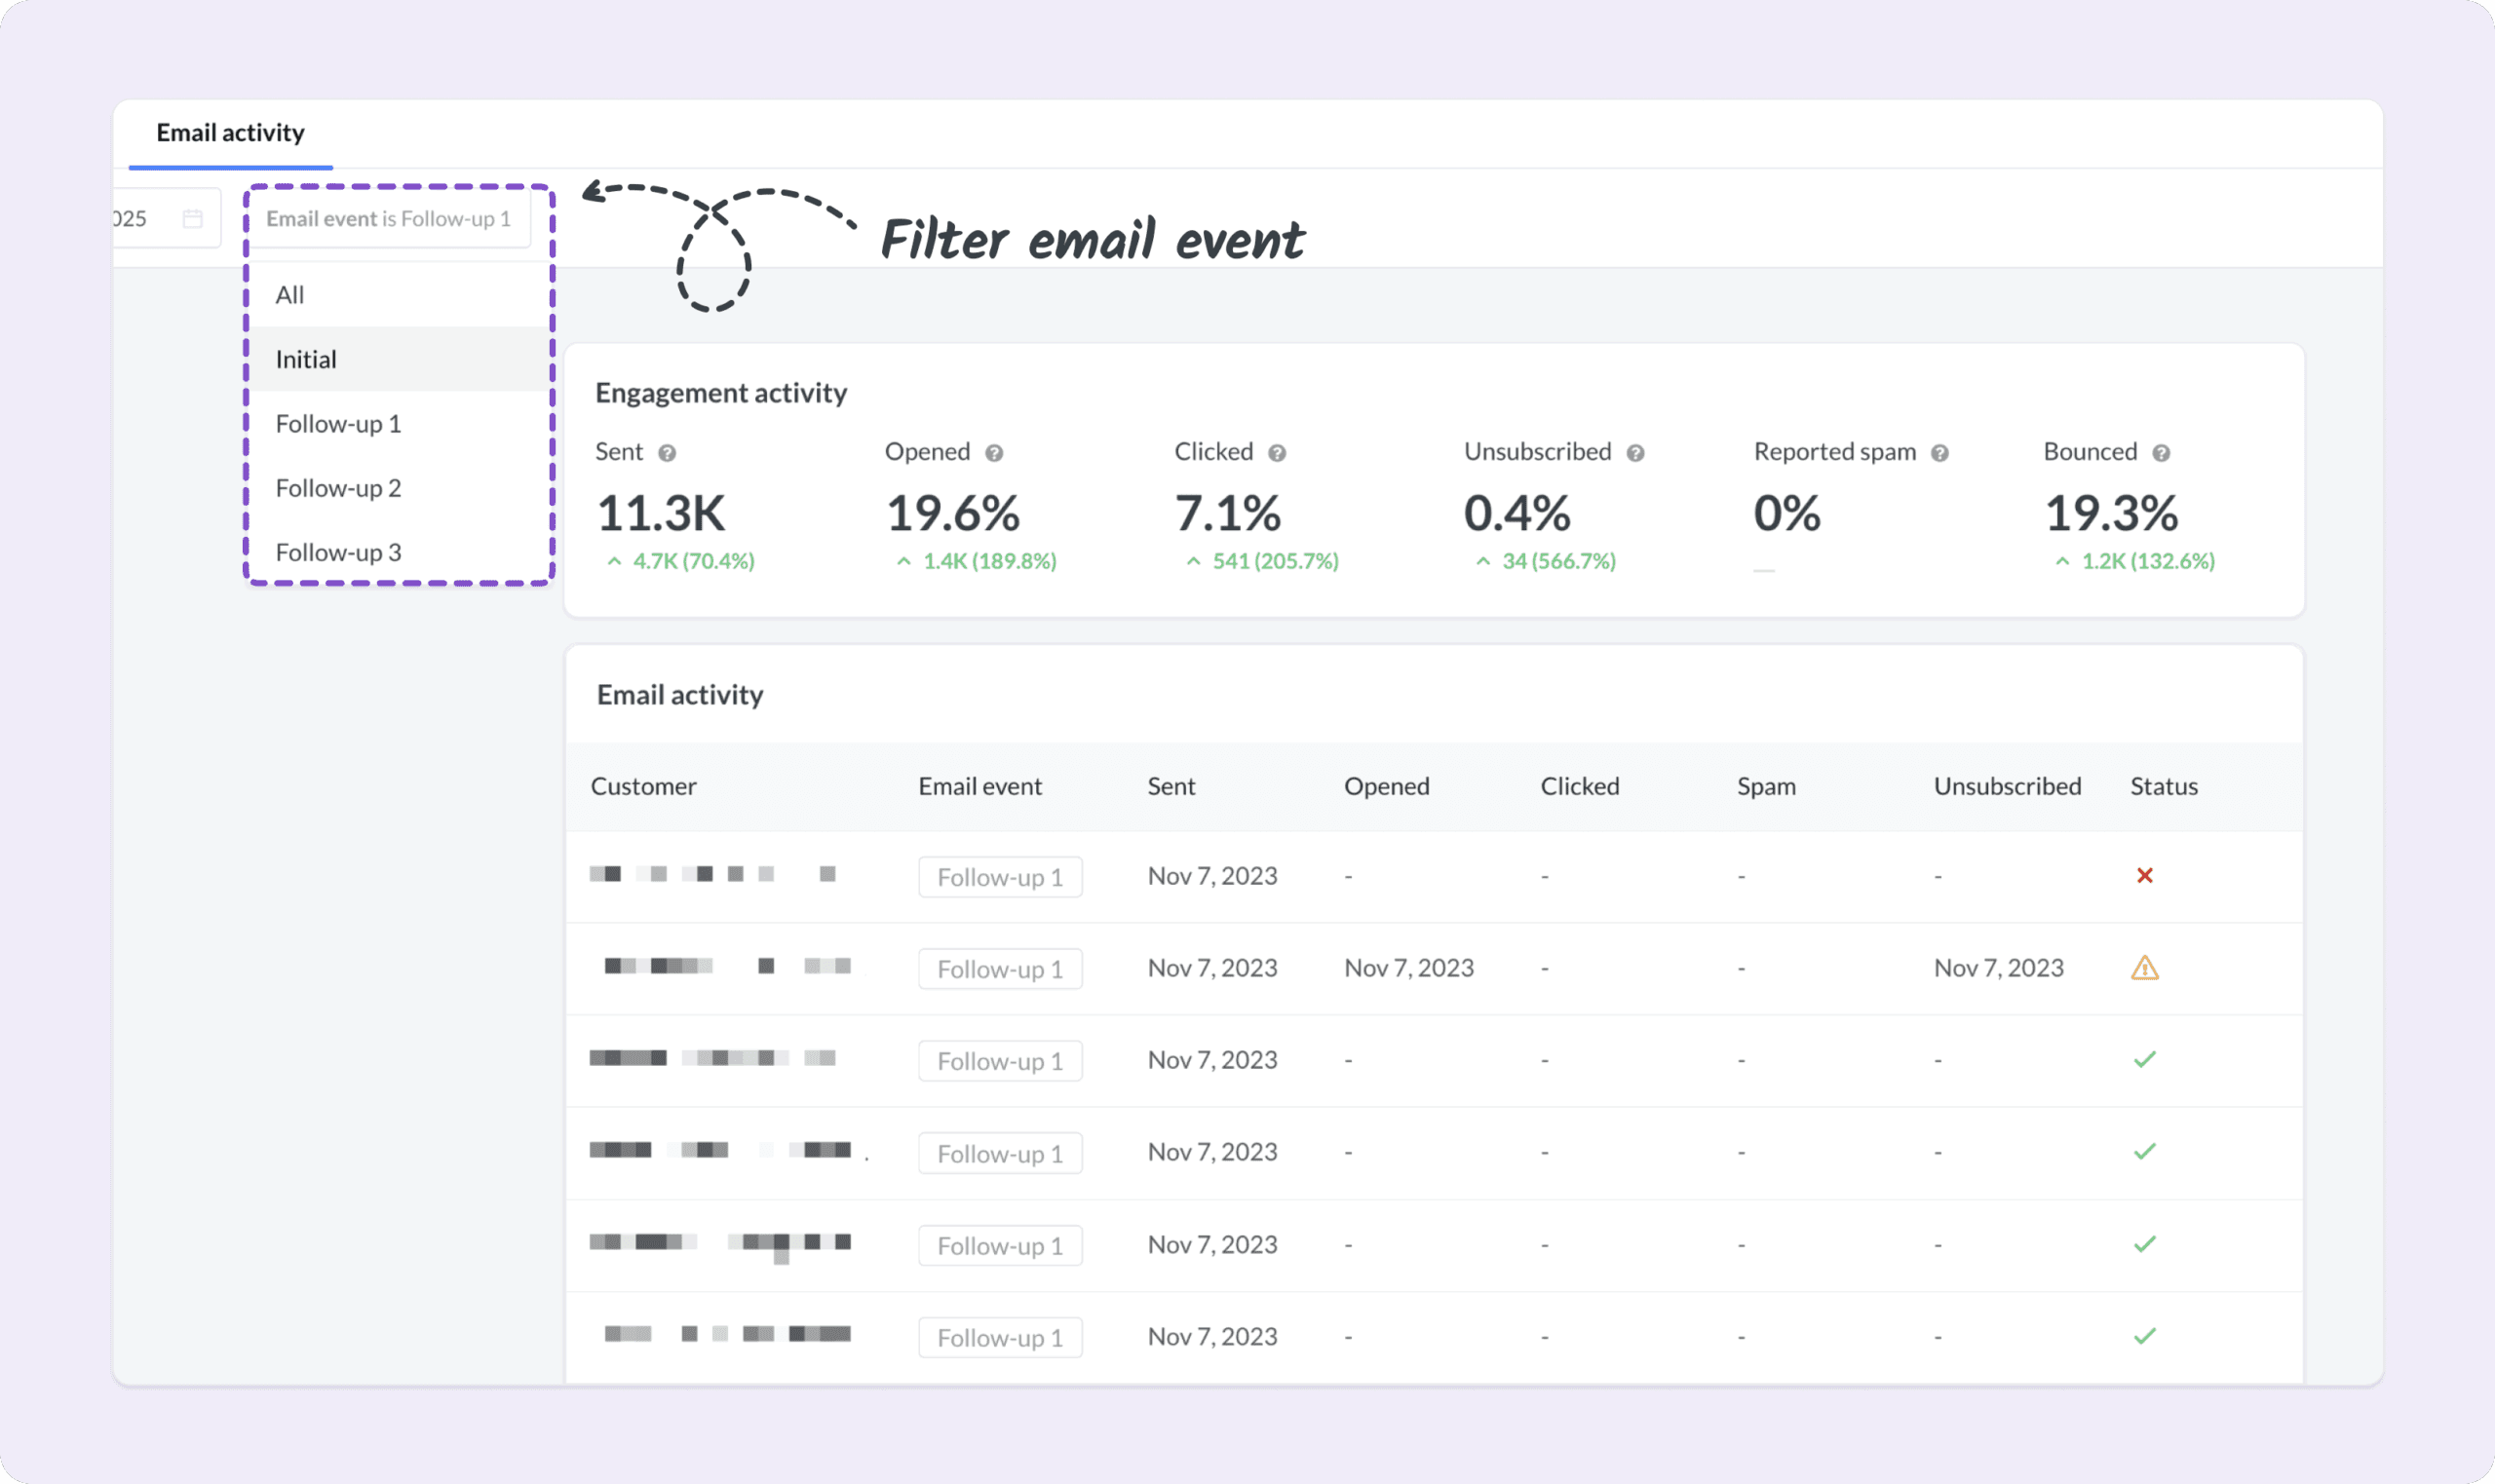
Advanced filters now include an Email event field, letting you filter by Initial send or specific follow-ups (1–3). Individual responses also display the related email event in the sidebar, when available.
Additional improvements
- Response rates now appear in Survey > Overview and Custom dashboards
- Filter reports by email event (Initial, Follow-up 1–3)
- Distinct Responded vs. Response rate stats for cleaner analysis
🛠️ Note: Accounts already using email embed surveys will need to update the embed code being used to enable response rate filtering.
Why it matters
📈 More ways to track response rates
Improved tracking means you get reliable numbers tied to customer engagement, not just sends.
🧠 Smarter diagnosis, faster optimization
By tying responses to the first open, your team can identify which delivery method performs best. Refine your strategy based on what works best for your customers
📬 One unified view
With enhanced dashboards and a single tracking model, you can filter by send type: initial email or follow-up. No jumping between tools or formats; just clean, actionable insight, all in one place.
Explore our in-depth guides to make the most of these features: Email activity → Response rate reporting enhancements
Built from real problems, shaped by real users
Everything in this release started with a conversation — with support leads tired of unclear data, CX managers needing better visibility, and survey owners looking for more flexibility without adding complexity.
We’re always listening to the real challenges teams are facing every day. Not just feature requests, but friction points, blind spots, and “why is this still so hard?” moments. Our goal, as always, is to make feedback work for you, not the other way around.
We’d love to hear what would make your workflow even better! Check out our public roadmap and let us know what you’d like to see next.
About Simplesat: Simplesat is the leading omnichannel survey app designed to enhance customer feedback management across various platforms, including Zendesk, Salesforce, and Gladly. Trusted by businesses worldwide, Simplesat delivers actionable insights that drive business growth and customer satisfaction.