Survey response rates are often treated as a simple benchmark for success. If the percentage looks high, CX teams celebrate. If it looks low, they panic.
But it’s crucial to ask whether those responses are representative and useful. A lower rate isn’t necessarily bad; it can reflect growing pains as you expand into new audiences. The real goal is collecting quality feedback you can act on!
This guide breaks down everything you need to know about survey response rates — how they’re calculated, what the benchmarks are and why they vary so widely, plus how to improve them without chasing empty numbers.
What is a survey response rate?
A survey response rate is the percentage of people who actually answered your survey compared to those who had the chance to do so.
Formula (standard):

This is different from a completion rate, which only measures how many people finished a survey after starting it:
Formula (completion rate):

Completion rate reflects survey design (are your questions clear and short?), while response rate reflects outreach effectiveness (are customers engaging at all?).
How survey response rates are calculated
Response rate calculations vary depending on the delivery method. The principle is always the same: responses divided by opportunities. But the denominator changes according to the channel.
Email surveys

This is the formula we use at Simplesat. Calculating response rates based on opens keeps the method consistent across email channels (direct sends and external embeds). Other tools may use emails or surveys sent instead, which can produce different results. If your response rate changes immediately and dramatically when switching tools, it might be because of differing formulas.

Example
- Emails sent: 1,000
- Bounces = 50 → Delivered = 950
- Opens detected: 600
- Responses: 90

But with a different — equally accurate! — definition, the result changes.

Completion rate
Example
- 200 people clicked into your CSAT survey.
- 180 finished all questions.

In-app or web widget surveys

Example
- 5,000 users log in to your app and see the survey widget.
- 1,250 respond.

SMS surveys

Example
- 2,000 SMS surveys sent.
- 100 failed delivery → 1,900 delivered.
- 285 responses received.

Link-based or QR code surveys

Example
- 1,200 people click a survey link in your newsletter or scan your QR code.
- 300 complete the survey.

Why consistent tracking improves survey response rate accuracy
Email surveys rely on opens, in-app surveys count impressions, SMS surveys depend on delivery reports, and link-based surveys measure page visits. Each method defines the denominator differently, which makes side-by-side comparisons tricky.
To reduce confusion, Simplesat uses the following best practices:
First-open attribution — Responses are linked to the first time the survey is opened, so you don’t double-count multiple views.
Unified tracking models — Whether a survey is sent via embedded email, a delivery provider, or another channel, the same rules are applied to calculate the denominator.
Separate statistics — Reporting both the raw number of responses (Responded) and the percentage of opens that turned into responses (Response rate) helps teams interpret results accurately.
Having a standardized framework gives CX teams a clearer baseline, allowing them to find out which channel engages their customers best.
💡 Simplesat tip: To refine your delivery strategy over time, use our engagement activity widget and view Delivered, Opened, Responded, and Response Rate side by side.
How response rates help CX teams — and when they mislead
Survey response rate is one of those metrics that looks straightforward at first glance: higher is better, lower is worse. But the truth is more complicated, and it’s important to maintain a realistic outlook on what response rates mean (and what they don’t).
Why is it important to track survey response rates?
Survey response rates aren’t just vanity numbers. They act as a diagnostic framework for CX teams, showing where customer feedback programs are healthy and where adjustments are needed.
Here are four areas where tracking response rates provides real value:
1. Spotting delivery problems
- A sudden drop in responses can indicate email deliverability issues, broken survey links, or technical errors in your survey embed.
- Low rates across the board might also highlight timing mismatches — for example, sending customer satisfaction surveys long after the interaction has passed.
Read more: When’s the best time to send out customer feedback surveys?
2. Comparing channels
Response rate benchmarks allow you to compare email surveys, SMS surveys, in-app surveys, and QR code surveys side by side. This helps identify which channel drives the strongest survey participation and where you may need to adjust your delivery strategy.
3. Building credibility with stakeholders
Leaders and cross-functional teams often want reassurance that customer feedback represents more than a handful of outliers.
Healthy survey response rates show that your program is reaching enough customers to make data-driven decisions with confidence.
4. Tracking your own progress
Industry benchmarks are helpful, but the most meaningful comparison is against your own past success.
Measuring against your history shows whether changes in survey design, timing, or delivery are actually improving participation — and whether your customer feedback program is trending in the right direction.
Why high survey response rates can be misleading
Where teams get into trouble is when they treat response rate as the ultimate success metric. Chasing a higher percentage at all costs can backfire!
- Goodhart’s Law in action — When you set a rigid response rate target, the measure stops being meaningful. You start optimizing for volume instead of insight.
- Over-surveying creates fatigue — Multiple reminders or unnecessary follow-ups may squeeze out a few more responses, but at the cost of frustrating customers. One in five customers abandon brands that use too many surveys.
- Incentives skew the sample — Offering discounts or rewards might boost response rates, but it risks biasing who responds and why.
- High response rate ≠ quality — A high rate that overrepresents one demographic or customer tier can distort your conclusions far more than a smaller but balanced sample.
There’s another hidden trap: response rates don’t reflect total feedback volume. As your company grows, expands into new markets, or experiments with new survey types, your response rate percentage might dip. But if your customer base doubles and your survey reach widens, a lower percentage can still yield far more responses overall.
For example:
- Last year, you had 500 customers and a 40% response rate → 200 responses.
- This year, you have 2,000 customers and a 20% response rate → 400 responses.
Percentages alone can mislead. A lower response rate during periods of growth or diversification isn’t a failure; it’s a sign that your program is scaling. Having a larger dataset gives you more confidence in trends and more ability to segment results across regions, products, or customer tiers.
The real priority: representativeness and total responses
The most useful question isn’t “Is my response rate high enough?” but:
- Am I hearing from the right mix of customers?
- Do I have enough total responses to trust the patterns I see?
You need enough feedback to reach statistical confidence and spot real trends. And input from the segments that matter most (profitable customers, recent buyers, key accounts) carries more weight than volume from disengaged or fringe groups.
A thoughtful 15% response rate that yields 300 balanced responses is far more valuable than a 40% rate that gives you only 40 skewed answers. But those are just examples. Realistically, what response rates can you expect?
Response rate benchmarks
In general, people scroll past online surveys more often than responding to them. Academic surveys sometimes reach a response rate of 40%, but those results are typically driven by incentives and motivated participants.
Customer feedback surveys sit comfortably in the 10-30% range. That may sound modest, but it’s in line with social science standards. It’s enough to generate statistically useful insights if the responses are representative.
Here’s what the data shows across the three most common customer satisfaction metrics:
📊 Customer feedback survey benchmarks
| Metric | Typical response rate | What's considered "good" |
|---|---|---|
| CSAT (Customer Satisfaction Score) | 20-30% average, varies wildly by delivery type | >40% = very good, <15% = warning sign |
| NPS (Net Promoter Score) | 5-25%, with B2B responses typically lower than B2C | >40% = impressive |
| CES (Customer Effort Score) | 15-20% average | >30% = very good |
Of course, the absolute numbers don’t matter nearly as much as consistency and representation. Benchmarks are a compass, not a finish line.
Note: Bain & Company, the creators of NPS, recommend NPS response rates of 40%+ for B2B and 60%+ for B2C. But we must keep in mind that the average open rate for business emails is only ~40% across industries. Even if every open led to a response (which it doesn’t), most companies would already be capped at Bain’s “minimum” target — depending on how you’re calculating the response rate.
This highlights why a single benchmark is misleading. Depending on whether you use sends, deliveries, or opens as your denominator, the same survey can show wildly different response rates. Chasing one “ideal number” is far less valuable than focusing on representativeness, total responses, and consistency over time.
Read more: How to encourage customers to fill out NPS surveys
When people see feedback turning into action, they stay engaged!
Read more: How to make the most out of feedback in every department
How to improve response rates and ensure quality
You don’t need tricks or gimmicks to ensure a higher response rate. Here’s a quick list of ways to ensure your surveys are relevant, respectful, and easy to complete.
1. Keep surveys short and contextual
- Limit surveys to a handful of relevant and insightful questions.
- Use branching or conditional logic to show only what’s relevant, instead of overwhelming every customer.
- Design for mobile — most surveys are opened on phones, so layouts must be quick to scan and tap through.
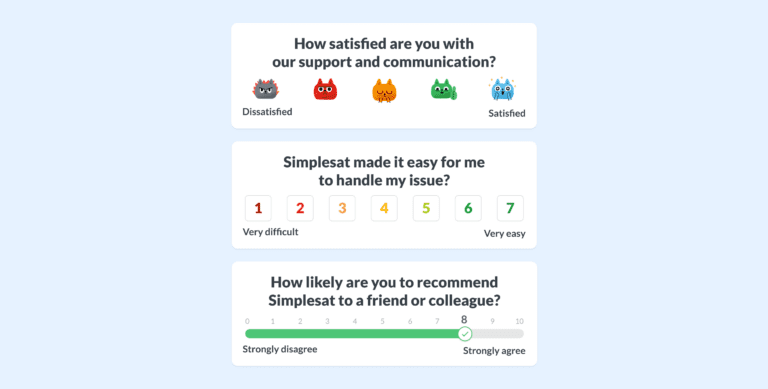
- Stick to clear scales (stars, smileys, 5-star ratings). Complex grids or sliders push people away.
💡 Simplesat tip: Use conditional question visibility. Show or hide follow-ups based on previous answers (e.g., respond to a low rating with “What made the experience frustrating for you?”).
2. Personalize outreach
- Customers are more likely to respond when the request feels personal and relevant.
- Avoid generic “dear customer” language.
- Make the survey look and feel like part of your brand.
This also addresses security concerns the customers might have! Make sure your surveys look and feel reliable.
3. Communicate purpose and impact
- Tell customers why you’re asking for feedback and how it will be used.
- Acknowledge their effort with a simple thank-you.
- Emphasize that their answers help improve their own future experience, not just internal KPIs.
4. Test timing and channels
- Feedback recall fades quickly, and 84% of customers are likeliest to respond immediately after an interaction.
- Match the channel to the context: email for periodic NPS, in-app for product feedback, chat or SMS for quick post-support checks.
- Don’t interrupt critical workflows — avoid mid-checkout popups.
- Use A/B testing to find the timing that resonates.
5. Use respectful reminders
One reminder 2-3 days later can boost responses by 30% or more, but too many reminders cause fatigue and can damage trust.
💡 Simplesat tip: Using the first-open attribution method shows which follow-up actually drove engagement.
6. Offer incentives (when appropriate)
- Small, relevant tokens (discounts, giveaways, early access) can encourage participation.
- But incentives should never bias results — reward everyone equally, not just those who give high scores.
Read more: How customer feedback surveys unintentionally bias respondents
7. Analyze and act with clarity
A higher response rate is only valuable if the data you collect is trustworthy, representative, and actionable.
Failing to analyze carefully creates the risk of false confidence. A decent response rate might feel like success, but if the sample is skewed, decisions based on it can backfire.
Best practices
- Separate raw counts from percentages. Knowing that 300 people responded is useful, but it tells a different story than “15% of customers responded.” Both metrics are important, but they must be interpreted together.
- Segment results. Overall numbers can hide patterns. Break down responses by customer tier, region, product line, or delivery channel to uncover where engagement is strong and where it lags.
- Track trends over time. A single month’s spike or dip doesn’t tell the whole story. Consistent reporting shows whether improvements are sticking or if new blind spots are emerging.
- Create custom dashboards and reports to slice results by team, geography, or channel. This helps CX leaders pinpoint exactly where engagement is healthy and where optimization is needed.
Ultimately, the goal isn’t just to increase response rates — it’s to build a feedback system you can trust!
Survey response rates vs. feedback quality: what really drives insight
Response rates rise and fall as your business evolves, your audience grows, and your survey methods change. In fact, dips often happen during moments of experimentation: when you try new channels or expand into new markets. That’s not a warning sign. It’s a healthy stage of growth.
What matters most is whether the customers who respond reflect the reality of your business — and whether their feedback gives you the clarity to make smarter decisions.
Frequently asked questions about survey response rates
What is a good survey response rate for customer satisfaction surveys?
A good response rate depends on the type of survey. For CSAT surveys, 20–30% is common, and anything above 40% is strong. NPS surveys typically see lower participation, often in the 5–25% range. CES surveys usually average 15–20%. What matters most is not just the percentage but whether the responses are representative of your customer base.
How do you calculate survey response rate vs. completion rate?
The formula for survey response rate is:
Completion rate, on the other hand, measures how many people finished the survey after starting it:
Response rate reflects engagement, while completion rate reflects survey design quality.
Why are my survey response rates low?
Low response rates usually come from four factors: survey design (too long or confusing), lack of motivation (customers don’t see the value), poor timing (sent too late or at the wrong touchpoint), or trust concerns (unclear branding or data use). Fixing even one of these can improve results.
How do NPS, CSAT, and CES response rates differ?
- CSAT surveys often have higher participation because they’re short and tied to specific interactions.
- NPS surveys can be harder to drive responses for, especially in B2B, since they ask about broader loyalty.
- CES surveys sit in the middle, usually around 15–20%, since they focus on the effort required in a recent interaction.
What are the best ways to improve customer survey response rates?
To improve survey response rates:
- Keep surveys short and contextual.
- Personalize outreach so requests feel relevant.
- Send surveys at the right time — ideally within 24 hours of the interaction.
- Use respectful reminders, but avoid over-surveying.
- Show customers that their feedback leads to visible improvements.
More responses are good, but the ultimate goal is quality, representative feedback.
About Simplesat: Simplesat is the leading omnichannel survey app designed to enhance customer feedback management across various platforms, including Zendesk, Salesforce, and Gladly. Trusted by businesses worldwide, Simplesat delivers actionable insights that drive business growth and customer satisfaction.