Understanding feedback
All you need to know about the Likert scale
On this page
The Likert scale is one of the most widely used tools in survey research. By offering a structured range of responses, it lets us measure people's attitudes, opinions, and feelings.
If you've ever been asked to rate how much you agree or disagree with a statement, then you've encountered a Likert scale before!
What makes the Likert scale so powerful? It provides a simple, quantifiable way to capture human perceptions, opinions, and behaviors.
By offering respondents a continuum of response options, it allows for nuanced insights that go beyond simple yes/no answers.
However, the Likert scale is not without its complexities. Cultural differences, biases, and survey response fatigue can affect responses. Let's look at how to use the Likert scale to gain valuable customer insights.
What is a Likert scale?
At its core, a Likert scale is a psychometric tool used to capture the intensity of people's opinions or attitudes. It was designed by social psychologist Rensis Likert in 1932, and it has many different forms.
A typical Likert scale consists of:
- a statement or question, and
- a range of response options that let the respondent express how much they agree or disagree.
The options usually range from "strongly disagree" to "strongly agree," but variations abound depending on the research context.
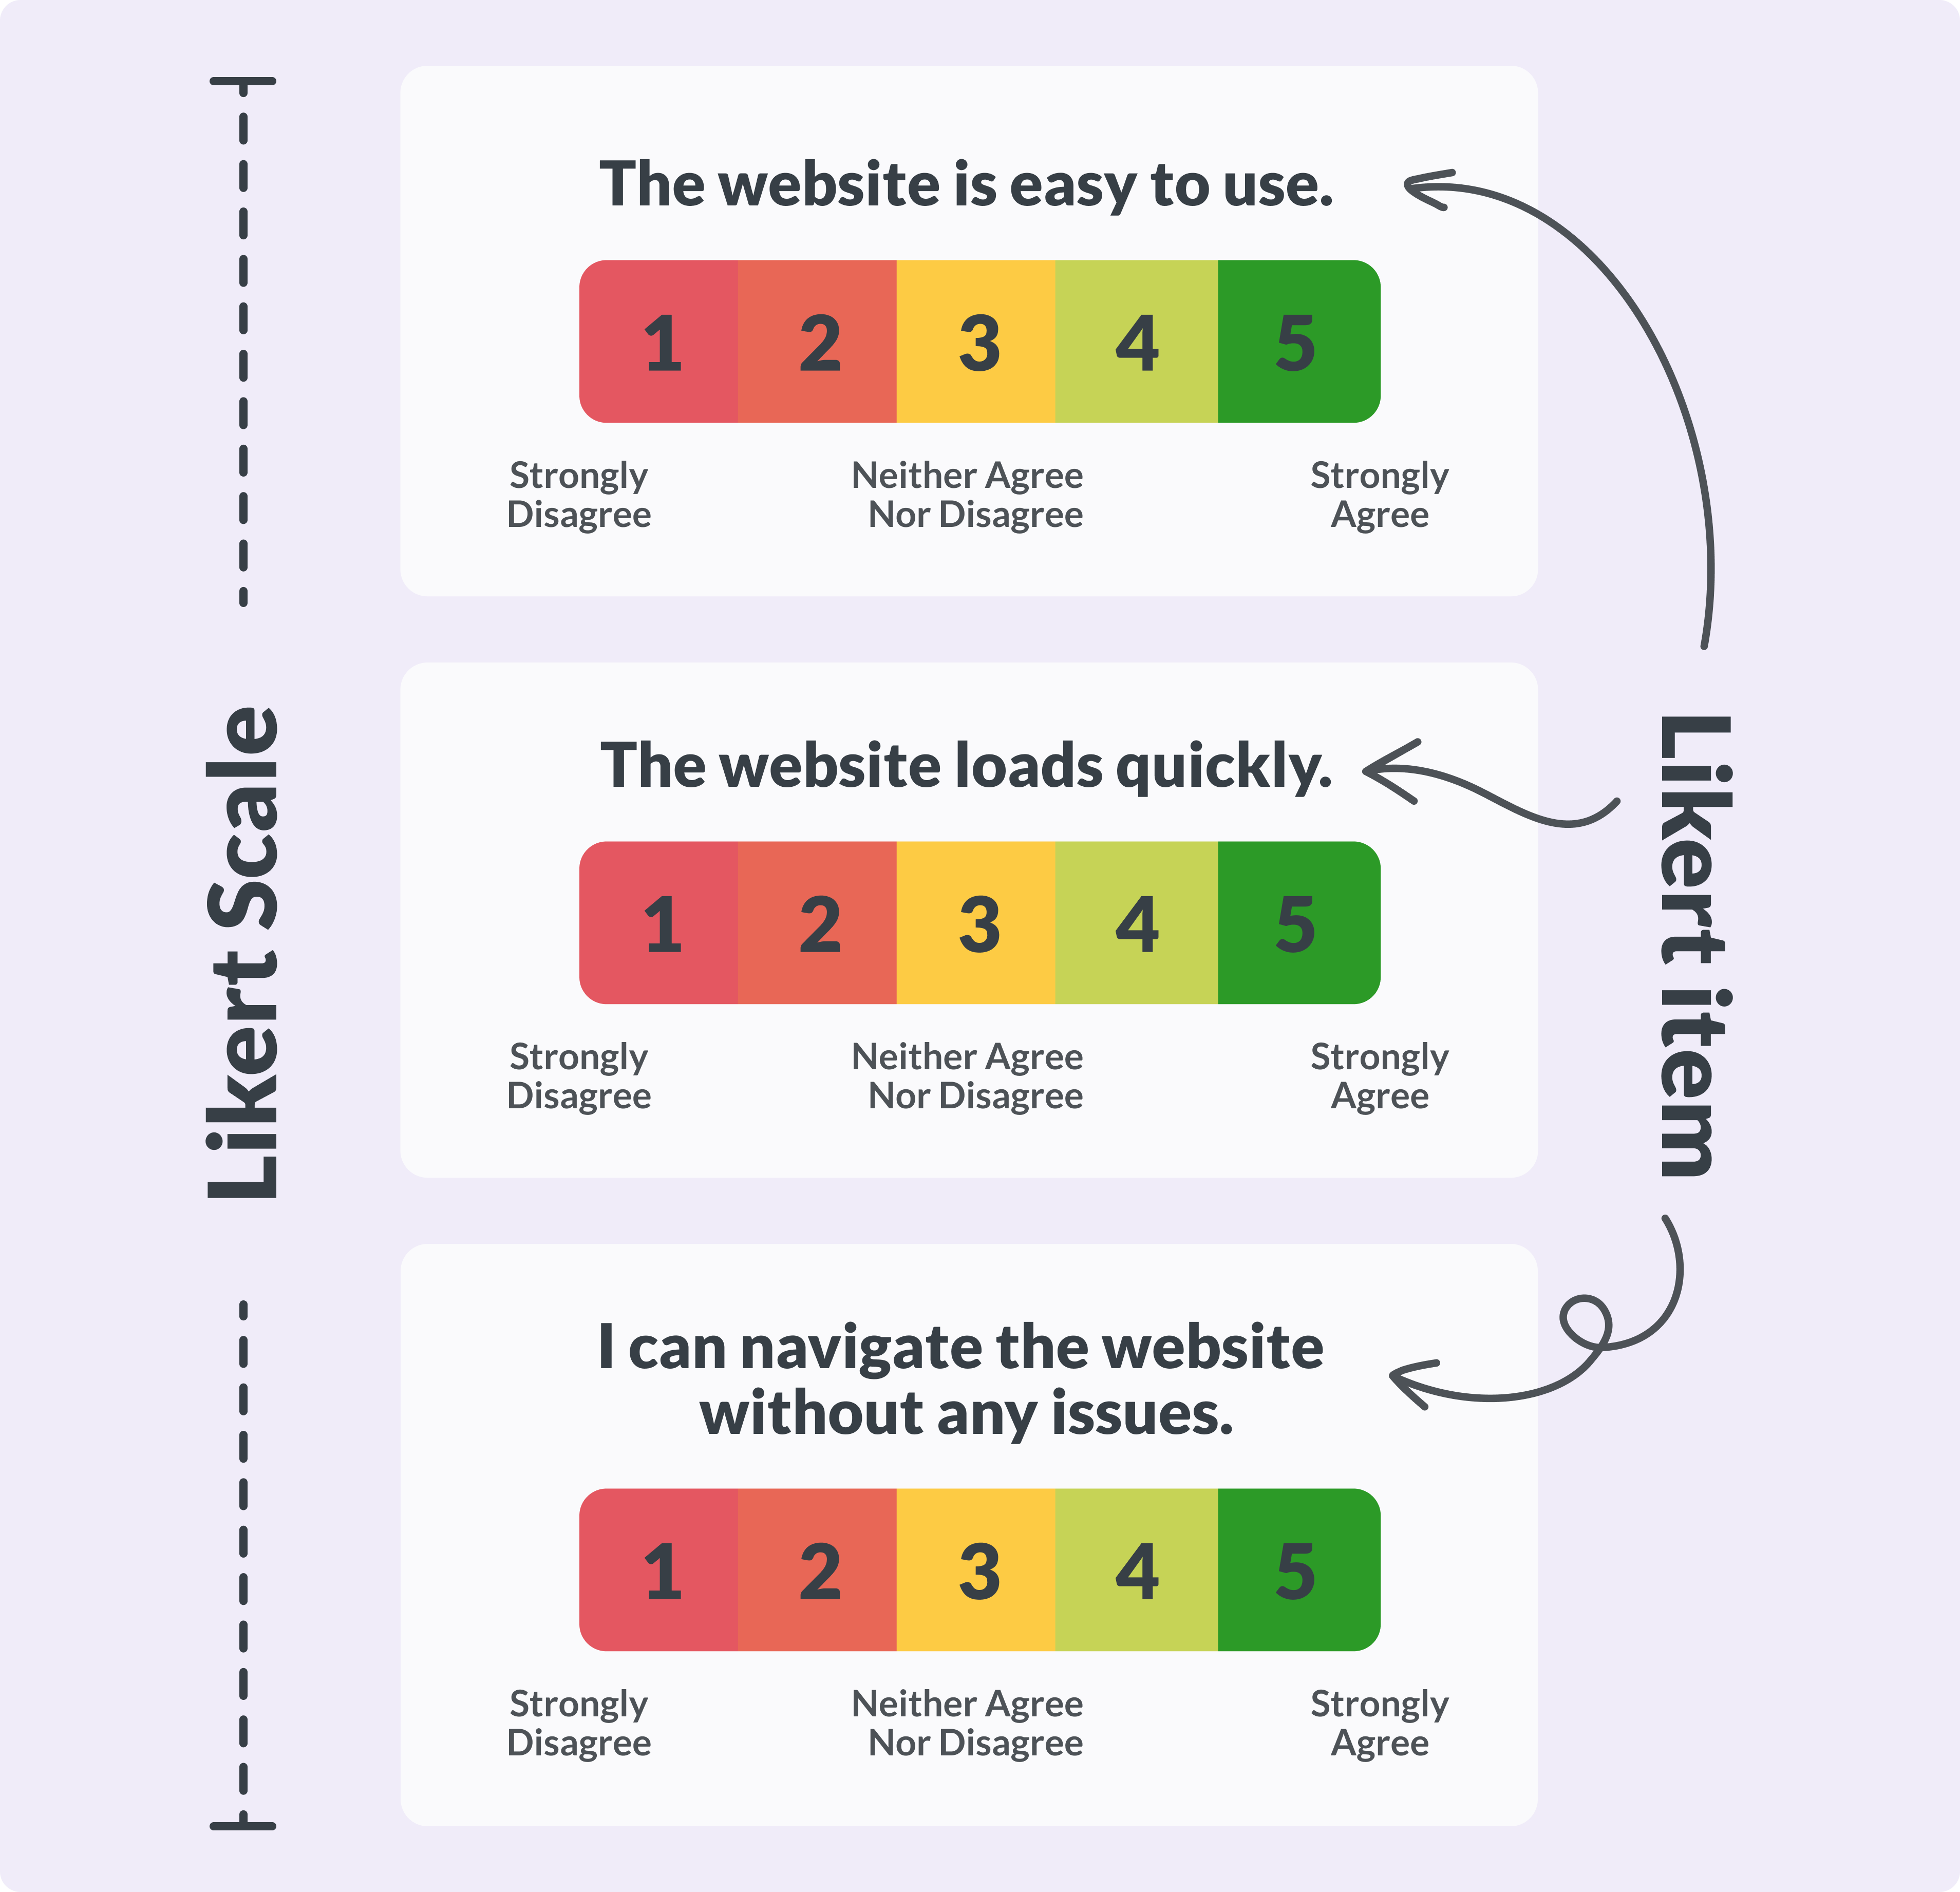
What's a Likert item?
There is some confusion online about the term Likert item vs. Likert scale, especially in a scientific research context.
A Likert item is a single statement that respondents are asked to evaluate, typically in terms of agreement or satisfaction.
A Likert scale, on the other hand, refers to the collection of several Likert items designed to measure a broader concept, like customer satisfaction.
Technically, it's the sum of multiple Likert items that creates a true Likert scale. But in informal contexts, we usually use the phrase "Likert scale" to describe any survey using a rating system.
Types & examples of Likert scales
Likert scales come in many formats, each offering different levels of granularity depending on the number of response options. The most popular formats are 5-point and 7-point Likert scales, but variations like 3-point, 4-point, and 10-point scales are also used, each with its own advantages and trade-offs.
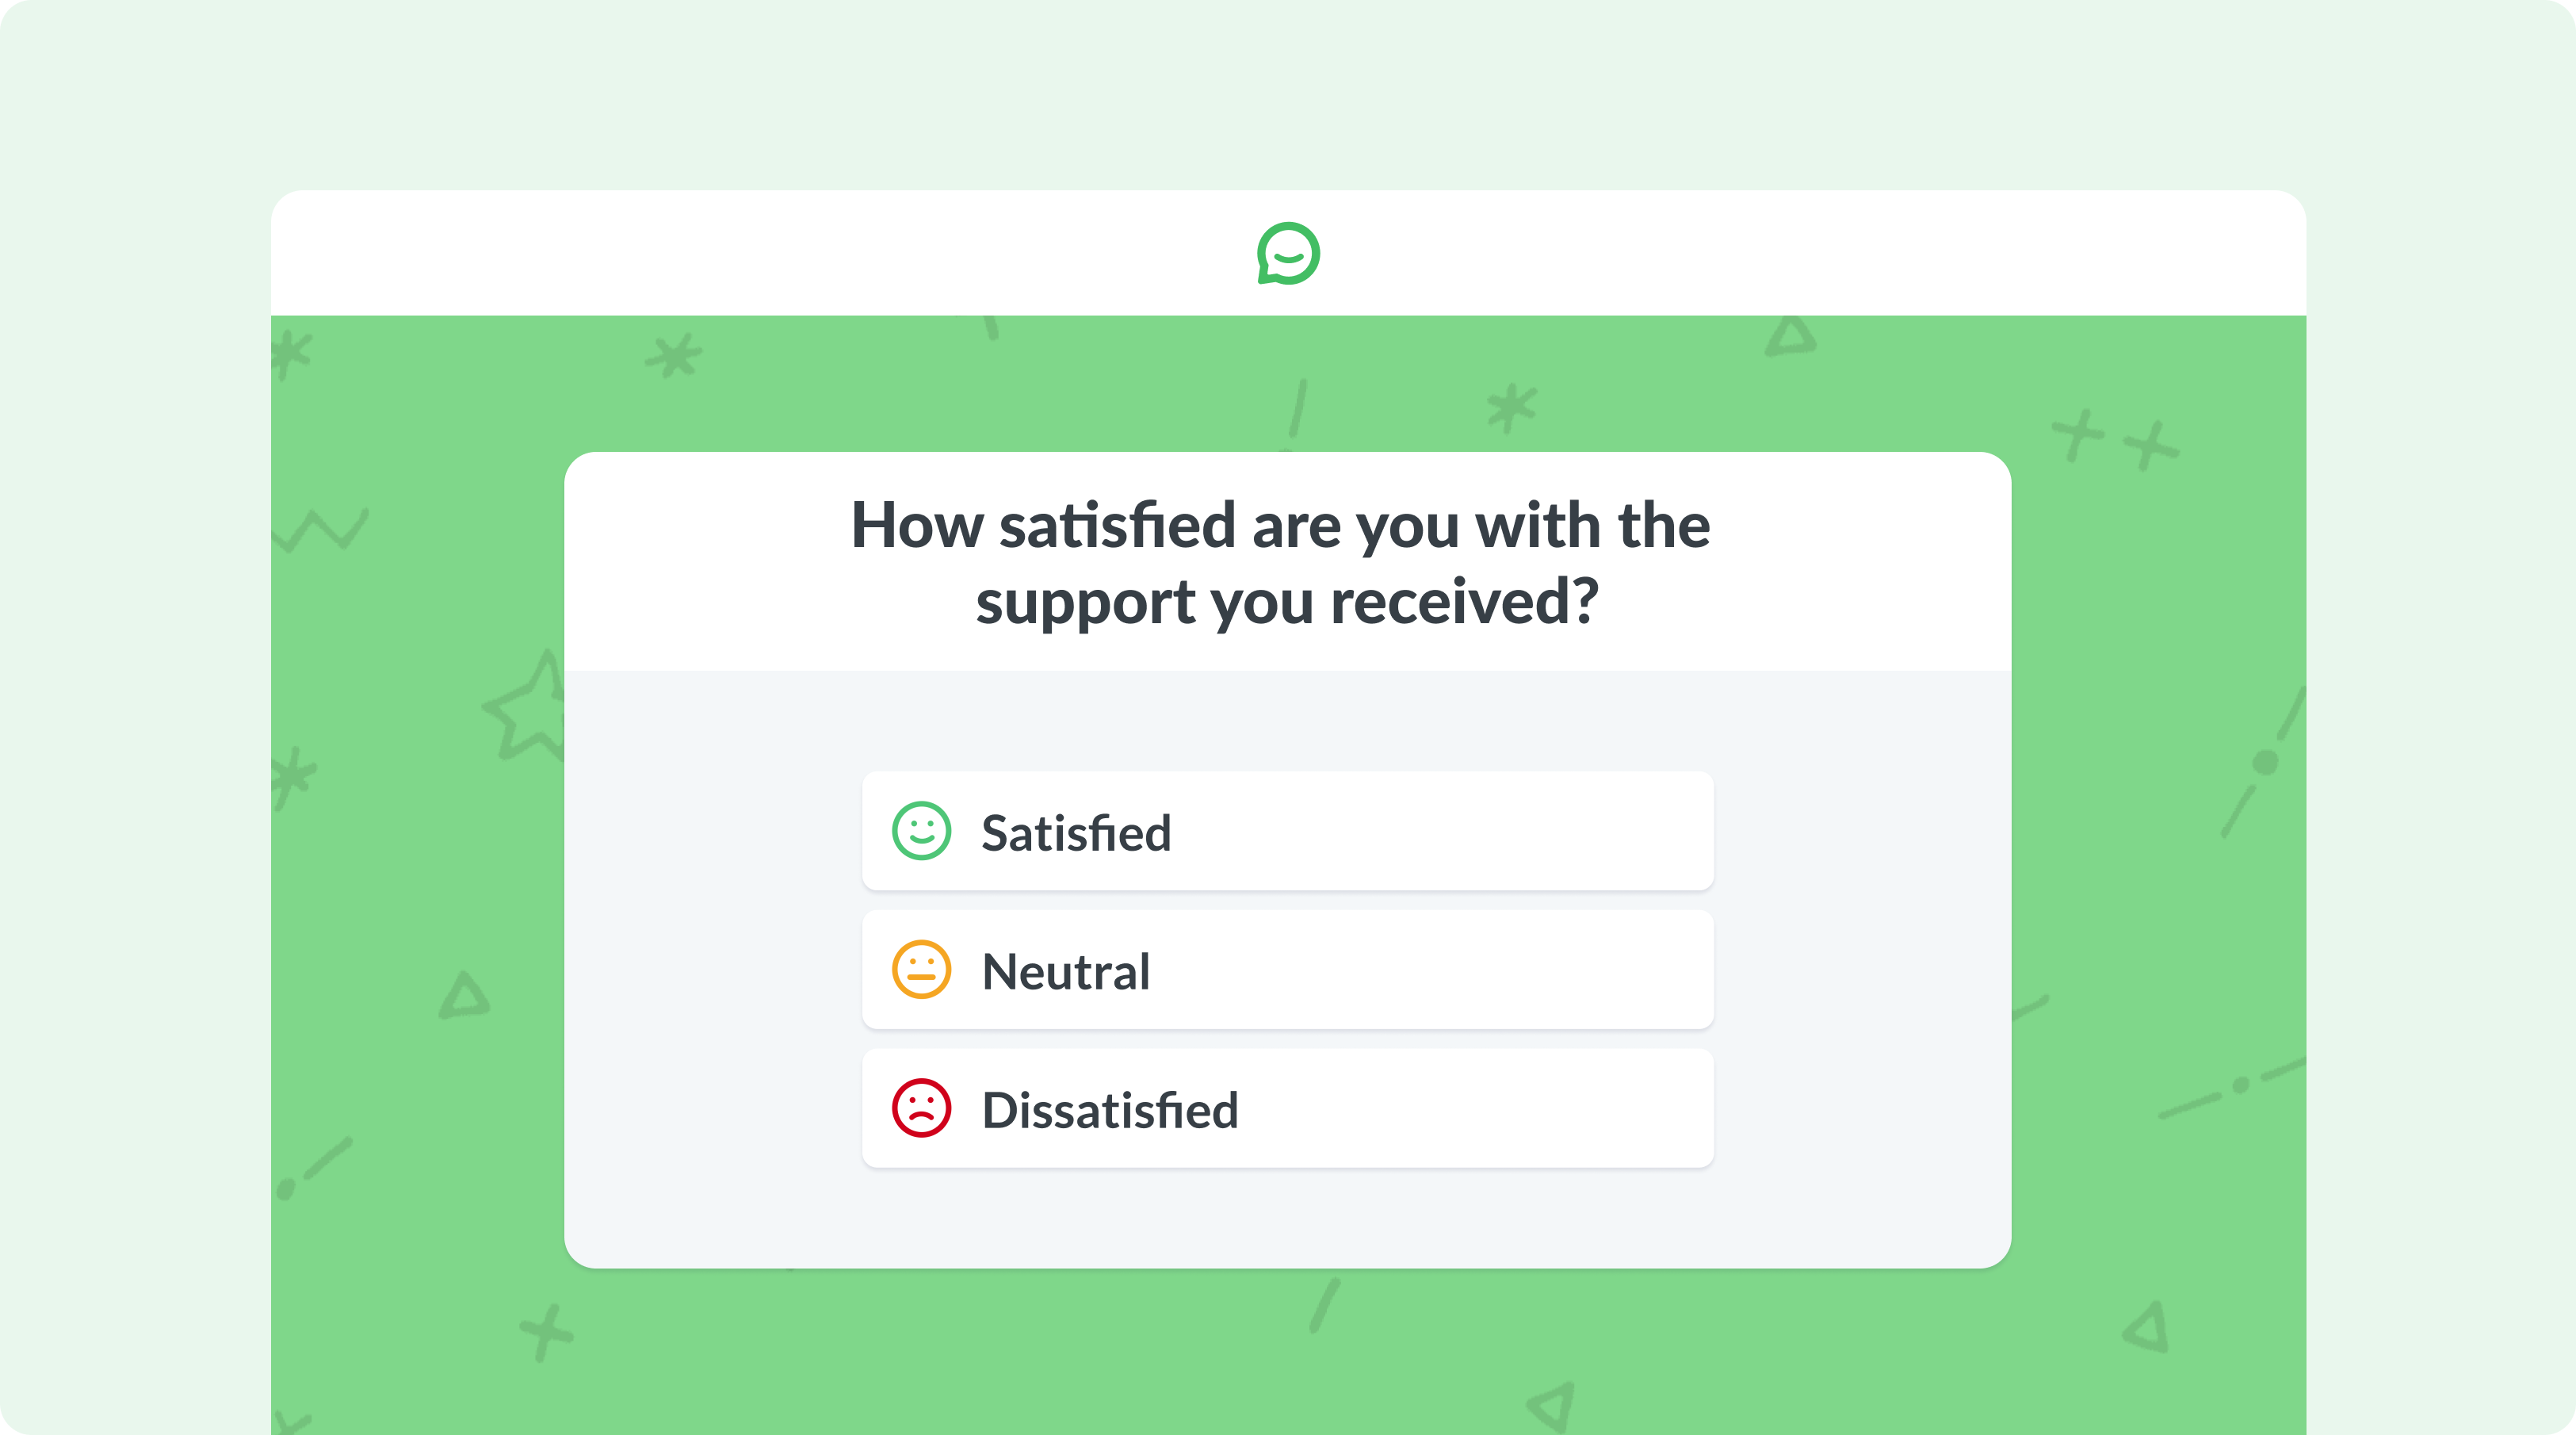
Perfect balance - the 5-point Likert scale
The 5-point Likert scale is perhaps the most common format for gathering feedback. It typically offers a middle-ground option, such as "neutral" or "neither agree nor disagree." The five response options usually include:
- Strongly disagree
- Disagree
- Neither agree nor disagree
- Agree
- Strongly agree
This format is easy for respondents to understand and doesn't overwhelm them with too many options. It also accommodates those who don't feel strongly one way or another by providing a neutral choice. For example, in a customer satisfaction survey, you might ask:
"The product meets my expectations."
Respondents could select one of the five options based on their level of agreement. However, while the 5-point scale is easy to use and interpret, it can lack subtlety.
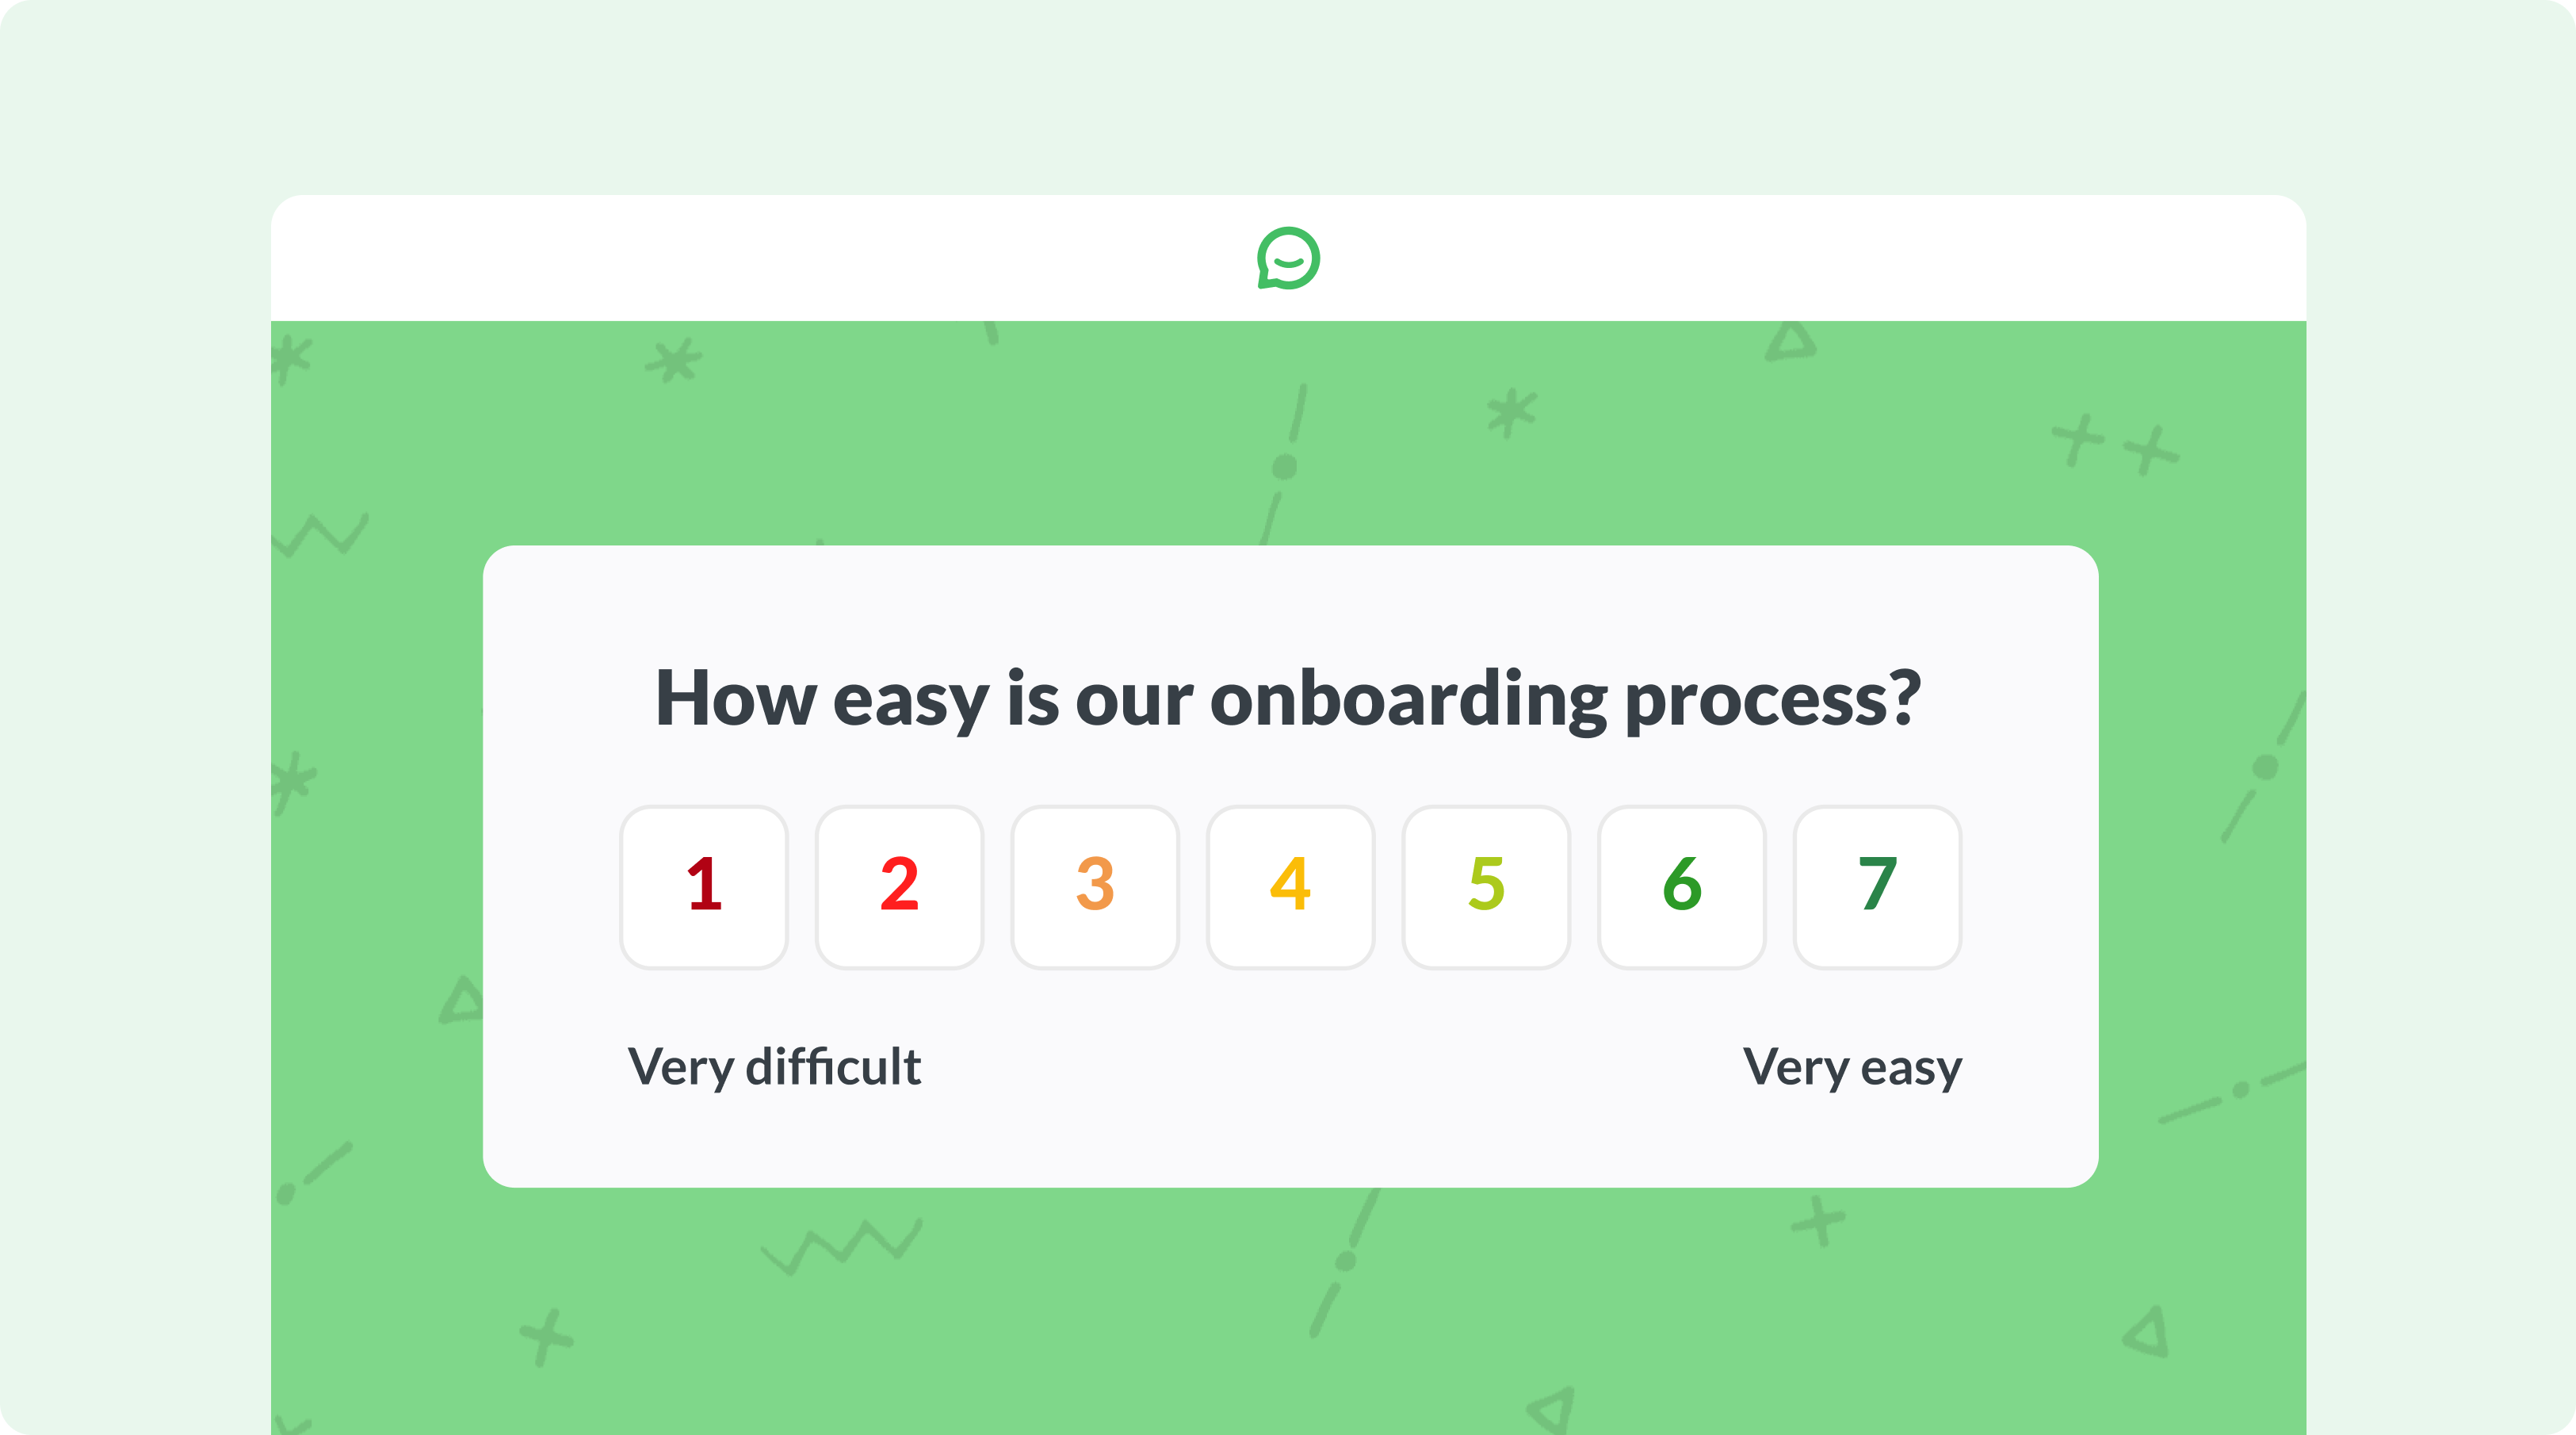
Shades of gray - the 7-point Likert scale
A 7-point Likert scale provides a bit more nuance by adding additional response options on either side of the neutral option. The typical responses might be:
- Strongly disagree
- Disagree
- Somewhat disagree
- Neither agree nor disagree
- Somewhat agree
- Agree
- Strongly agree
This format is especially useful when you want to capture finer variations in satisfaction levels. By offering more nuanced options, it can help identify subtle differences in customer experiences. For example, in a customer satisfaction survey, you might ask:
"The new upgrade fits my needs."
A 7-point scale allows respondents to express a more precise range of opinions, like being "moderately satisfied" or "slightly dissatisfied," with the upgrade in question.
This additional level of detail can be crucial when you're trying to understand not just whether customers are satisfied, but how strongly they feel about specific aspects of your product or service. Crucially, you can see the difference between mildly inconvenienced customers and unhappy customers who are at risk of canceling.
On the other hand, the 7-point Likert scale can also lead to indecision for some respondents who struggle to distinguish between options like "slightly satisfied" and "moderately satisfied." As a consequence, they might pick an option at random, or they'll exit the survey altogether.
Do you need to label every point on the scale?
As long as it's clear that 1 means "Strongly disagree" and 7 means "Strongly agree," you don't need to label every point in between. Most respondents will understand the progression intuitively, and over-labeling can clutter the survey without adding much value.
Keeping it simple - the 3-point Likert scale
A typical 3-point scale might look like this:
- Disagree
- Neutral
- Agree
While it limits the range of possible responses, this format can be useful for quick assessments or when respondents may be pressed for time.
It's easy to understand and requires little effort, making it ideal for pulse surveys or situations where you want to avoid overwhelming your audience. For example, you could use a 3-point scale in a quick check-in survey asking:
"I am happy with the direction the brand is heading."
This scale doesn't allow for as much nuance as longer scales, but it provides a snapshot of opinion without requiring the respondent to overthink their answer. You can use emojis instead of numbers to make the point even clearer to an international user base.
No fence-sitting allowed - the 4-point Likert scale
You can also opt for a 4-point Likert scale, which eliminates the neutral middle option entirely. A typical format might include:
- Strongly disagree
- Disagree
- Agree
- Strongly agree
The absence of a neutral option forces respondents to take a position, which can be useful when you're trying to reduce the likelihood of non-committal answers. For example, in a customer satisfaction survey, you might ask:
"I am satisfied with the level of support I received from customer service."
A 4-point Likert scale would push respondents to either agree or disagree, providing more decisive feedback. However, the downside of this approach is that some respondents may genuinely feel neutral and could become frustrated by the lack of that option, leading to less reliable data.
What is a forced-choice scale?
Likert scales with an even number of responses count as forced-choice scales, as they don't allow for a neutral or "middle ground" response. This format compels participants to take a stance, either agreeing or disagreeing with a statement.
But there are other ways to force a choice, such as asking customers to pick one out of a multiple-choice list or to rank options from their favorite to their least favorite.
Precision in every response - the 10-point Likert scale
When even more granularity is needed, some researchers use a 10-point Likert scale. This version expands the range of responses significantly.
This scale offers greater precision and can be ideal for more complex or high-stakes assessments. For instance, in market research where the stakes are high-such as evaluating a new product's potential in the market-a 10-point Likert scale might be used to capture highly detailed consumer sentiments. If you'd prefer to avoid a neutral option, go for a 9-point scale!
The obvious downside in this case is the risk of choice overload, meaning that the customer becomes more likely to skip the survey altogether.
Likert scale best practices
Let's look at some decisions you need to make before you start creating a Likert scale survey.
1. Choosing the right number of response options
The upsides and downsides of various Likert scales have already been discussed. Each has its own strengths based on the level of detail and the cognitive load you want to place on respondents. The question then becomes: how granular do you want the feedback to be?
High vs. low number of response options
More granularity-such as a 7-point, 9-point, or 10-point scale-offers respondents a wider range of options to express their opinions. This can be particularly useful in customer satisfaction surveys where you're measuring subtle differences in experience.
However, the downside is that too many options can overwhelm respondents. Cognitive load increases as the scale becomes more complex, leading to decision fatigue. This can cause participants to choose arbitrarily or default to the middle option, diminishing the quality of the data.
On the other hand, less granularity-like a 3-point or 5-point scale-can be beneficial when simplicity is key. Fewer options reduce the mental effort required to respond and increase completion speed. A 5-point scale is often enough to get a general sense of customer satisfaction, offering a good balance between simplicity and sufficient differentiation. But, it might not capture all the nuances, especially if your survey deals with complex concepts or emotions.
Even vs. odd number of responses
When designing your Likert scale, another critical decision is whether to offer an even or odd number of response options.
With an odd-numbered scale (such as a 5-point or 7-point scale), respondents have the option to select a neutral or middle response. This can be valuable for gathering balanced feedback, especially when you want to capture opinions that aren't strongly polarized.
However, there are cases where you might want to push for more decisive feedback. This is where an even-numbered scale (such as a 4-point or 6-point scale) comes into play.
By forcing the choice, you can receive more useful feedback, especially considering the central tendency bias - a psychological bias that causes some people to default to the middle option in surveys without thinking about it.
Recommended reading: Cognitive biases in survey analysis
2. Bipolar vs. unipolar Likert scales
Depending on the purpose of your research, you may choose between bipolar and unipolar Likert scales. Each type offers distinct advantages and is suited to different kinds of measurement.
Bipolar Likert scale examples
A bipolar Likert scale asks respondents to rate their opinion across a spectrum that includes both positive and negative ends. Bipolar scales are best suited for measuring attitudes with opposing ends, like:
- Agreement vs. disagreement (e.g., "I find the product easy to use")
- Positive vs. negative sentiment (e.g., "I am happy with the service")
For example, a statement might ask, "How much do you agree with this statement?" with response options ranging from "Strongly Disagree" to "Strongly Agree."
Unipolar Likert scale examples
In contrast, a unipolar Likert scale measures the degree of presence or intensity of a single concept.
This format is particularly effective for:
- Measuring customer loyalty (e.g., "How likely are you to recommend our product?")
- Gauging ease of use (e.g., "How easy was it to navigate our website?")
For example, a unipolar scale might ask, "Did you find this documentation helpful?" with response options ranging from "Not helpful at all" to "Extremely helpful." There is no opposite concept (at worst, the documentation did nothing, there is no option where it caused harm).
Bipolar or unipolar?
Bipolar scales offer more direct comparisons between opposing attitudes, which can make it easier to interpret polarized views. However, respondents might feel forced to take a stance they don't fully agree with, especially if they prefer neutral positions.
Unipolar scales are often easier for respondents to understand, as they focus on a single dimension of experience. Still, they can lack the depth of analysis that comes from comparing opposing viewpoints.
3. Labeling the scales
Overly long or complex labels can confuse respondents and lead to misinterpretation. Use concise and consistent labels - it's best to stay with "strongly agree," "agree," "neutral," etc.
But keep in mind that people's cultural and linguistic backgrounds shape how they perceive labels. For instance, the term "satisfied" might translate as "content" in one language, which conveys a more passive sense of approval, while in another, it might imply a stronger sense of fulfillment.
When conducting surveys across multicultural or international audiences, be mindful of these linguistic differences. When appropriate, using emojis can help bring the point across too.
First is best? Ascending vs. descending Likert scales
Here's another interesting question to consider when structuring your scale: should the "Strongly Agree" option be on the right or the left side of the scale?
An ascending scale starts with the most negative option and moves toward the most positive.
A descending scale places the most positive option first.
Which should you use? Experts are divided on the question.
- Some studies show that a descending scale tends to skew the responses in a positive direction due to a combination of acquiescence bias and social desirability bias. In other words: customers are suggestible, and if you offer them a very positive option first, they're likelier to take it. "First is best" is a common way to refer to this phenomenon.
- On the other hand, it's not clear how significant the influence of these biases is. Some studies found no difference between ascending and descending scales.
If you are eager to encourage more negative survey responses, stick to ascending Likert scales. Testing both formats can help you identify which yields more reliable insights!
Much more important is consistency and good design. Some customers won't read the label at all, so make it as clear as possible which end of the scale is which. Keep your labels short, and use color-coding where appropriate. In Simplesat surveys, we use red for the negative and green for the positive side of the scale.
4. Asking the right question
Likert scale surveys can take various forms, with several question types frequently employed:
- Likelihood - These questions assess how likely respondents are to take a specific action, such as signing up for a membership or purchasing a product. They're particularly useful for gauging potential behaviors rather than mere preferences.
- Satisfaction - This type measures how satisfied customers are with a service, product, or overall experience. Satisfaction questions provide valuable insights into customer feelings and areas for improvement.
- Importance - To understand how strongly people feel about a particular service or product, you can use Likert scale questions that measure the perceived importance of various aspects of their experience.
- Frequency - These questions measure how often respondents engage in a particular behavior or experience. For example, "How often do you use our product?" with response options ranging from "Never" to "Always." This type can help identify usage patterns and trends.
- Quality - Quality questions assess the perceived quality of a product or service. An example could be, "How would you rate the quality of our customer support?"
- Agreement - These questions focus on whether respondents agree or disagree with a statement. For example, "I consider this brand to be the best in its category."
- Value - Value questions measure the perceived value of a service or product relative to its cost. An example might be, "How would you rate the value for money of our service?" Responses can provide insights into pricing strategy.
- Clarity - Clarity questions assess how clear or understandable a product, service, or communication is. For instance, "How clear was the information provided about our service?"
- Experience - Experience questions focus on the overall experience a customer has with a product or service. An example could be, "How would you rate your overall experience with our website?" This gives a holistic view of customer interaction.
Incorporating a mix of these question types can provide a more rounded understanding of customer perceptions, behaviors, and areas for improvement, leading to more effective decision-making and strategy formulation.
Recommended reading: The ultimate guide to customer survey questions
If you are looking to measure customer satisfaction, apply the RATER framework to your Likert scale. This means measuring satisfaction in five dimensions:
- "The company reliably delivers on its promises." (Reliability)
- "The staff made me feel confident and well-assisted." (Assurance)
- "The facilities are clean and visually appealing." (Tangibles)
- "The company showed genuine care for my needs." (Empathy)
- "I received prompt and effective help." (Responsiveness)
These statements could be rated using a 5-point or 7-point Likert scale, turning qualitative RATER dimensions into quantifiable data that can be analyzed for customer satisfaction insights.
In short, the RATER model identifies what to measure, and the Likert scale provides a structured way to measure it.
Avoid ambiguity in your phrasing
Each statement should focus on a single idea or sentiment. Avoid double-barreled questions-those that ask respondents to evaluate more than one aspect at a time (e.g., "The product is easy to use and affordable").
- "The customer service team was helpful in resolving my issue."
- "The customer service team was helpful and fast."
Questions or statements?
Some Likert items are phrased as questions - "How satisfied are you with our checkout process?"- while others are statements, usually in 1st person, such as: "I easily found the product I needed.'
Which you prefer depends on your brand identity.
As before, there's a risk of acquiescence bias; if you use a statement, the customer is likelier to agree with it. A question is less likely to induce that bias in the respondent.
On the other hand, you can increase empathy in customer relationships by using statements that echo their point of view. For example, a customer might feel less defensive if you phrase it as "I found the new layout confusing." versus the more confrontational "Were you confused by the new layout?"
5. Avoiding common pitfalls
The success of the Likert scale stems from its ability to tap into fundamental aspects of human decision-making. When respondents answer a Likert item, they engage in a quick process of evaluating the statement against their own feelings and experiences.
Keeping that in mind, here are some common mistakes that come up in Likert scale surveys:
😵 Too many questions
Shorter surveys tend to provide better results. As respondents tire, they may start selecting the same answer repeatedly, simply to finish the survey faster. This tendency can distort the accuracy of the feedback and lead to skewed results. Therefore, it's essential to design surveys with an optimal number of items to avoid overburdening participants.
🗺️ One-size-fits-all data interpretation
People from more collectivist cultures (like those in East Asia) tend to avoid extreme responses and are more likely to select middle options, while individuals from individualistic cultures (like in the US) often opt for stronger, more polarized answers. Understanding these cultural tendencies can help researchers better interpret the data.
🎯 Leading or biased questions
If the wording of the statement subtly encourages a particular answer, it can skew the results. For example, a question like "Our service is the best in the industry" might lead to more positive responses than a neutral phrasing such as "How do you rate our service?" Neutral and unbiased language ensures that respondents can answer based on their true experiences and opinions.
🚫 Overlapping or inconsistent response options
Response options need to be mutually exclusive and clear. For instance, on a frequency scale, avoid overlapping terms like "often" and "frequently," as respondents may not know how to differentiate between them. Ambiguous or redundant options can confuse participants and lead to unreliable data.
🔄 Lack of reverse-coded items
If all your Likert items are worded positively, respondents may fall into a response pattern or bias, selecting the same response across the board. Mixing in negatively worded items, called reverse coding, can help avoid this bias and ensure respondents are paying attention to each question individually. However, be careful not to make reverse items too confusing.
🎲 Inconsistent scales across the survey
Switching between different types of Likert scales (e.g., from a 5-point to a 7-point scale) within the same survey can throw off respondents and disrupt their flow. Using consistent scales helps maintain focus and delivers cleaner, more comparable data.
🔍 Ignoring the analysis stage
Even with perfect design, the way you analyze Likert scale data is crucial. Treating ordinal data (like Likert scales) as continuous can lead to inappropriate statistical analysis. Be mindful of how you interpret the results and whether the data meets the assumptions required for the type of analysis you plan to perform.
Recommended reading: Complete guide to satisfaction survey data analytics
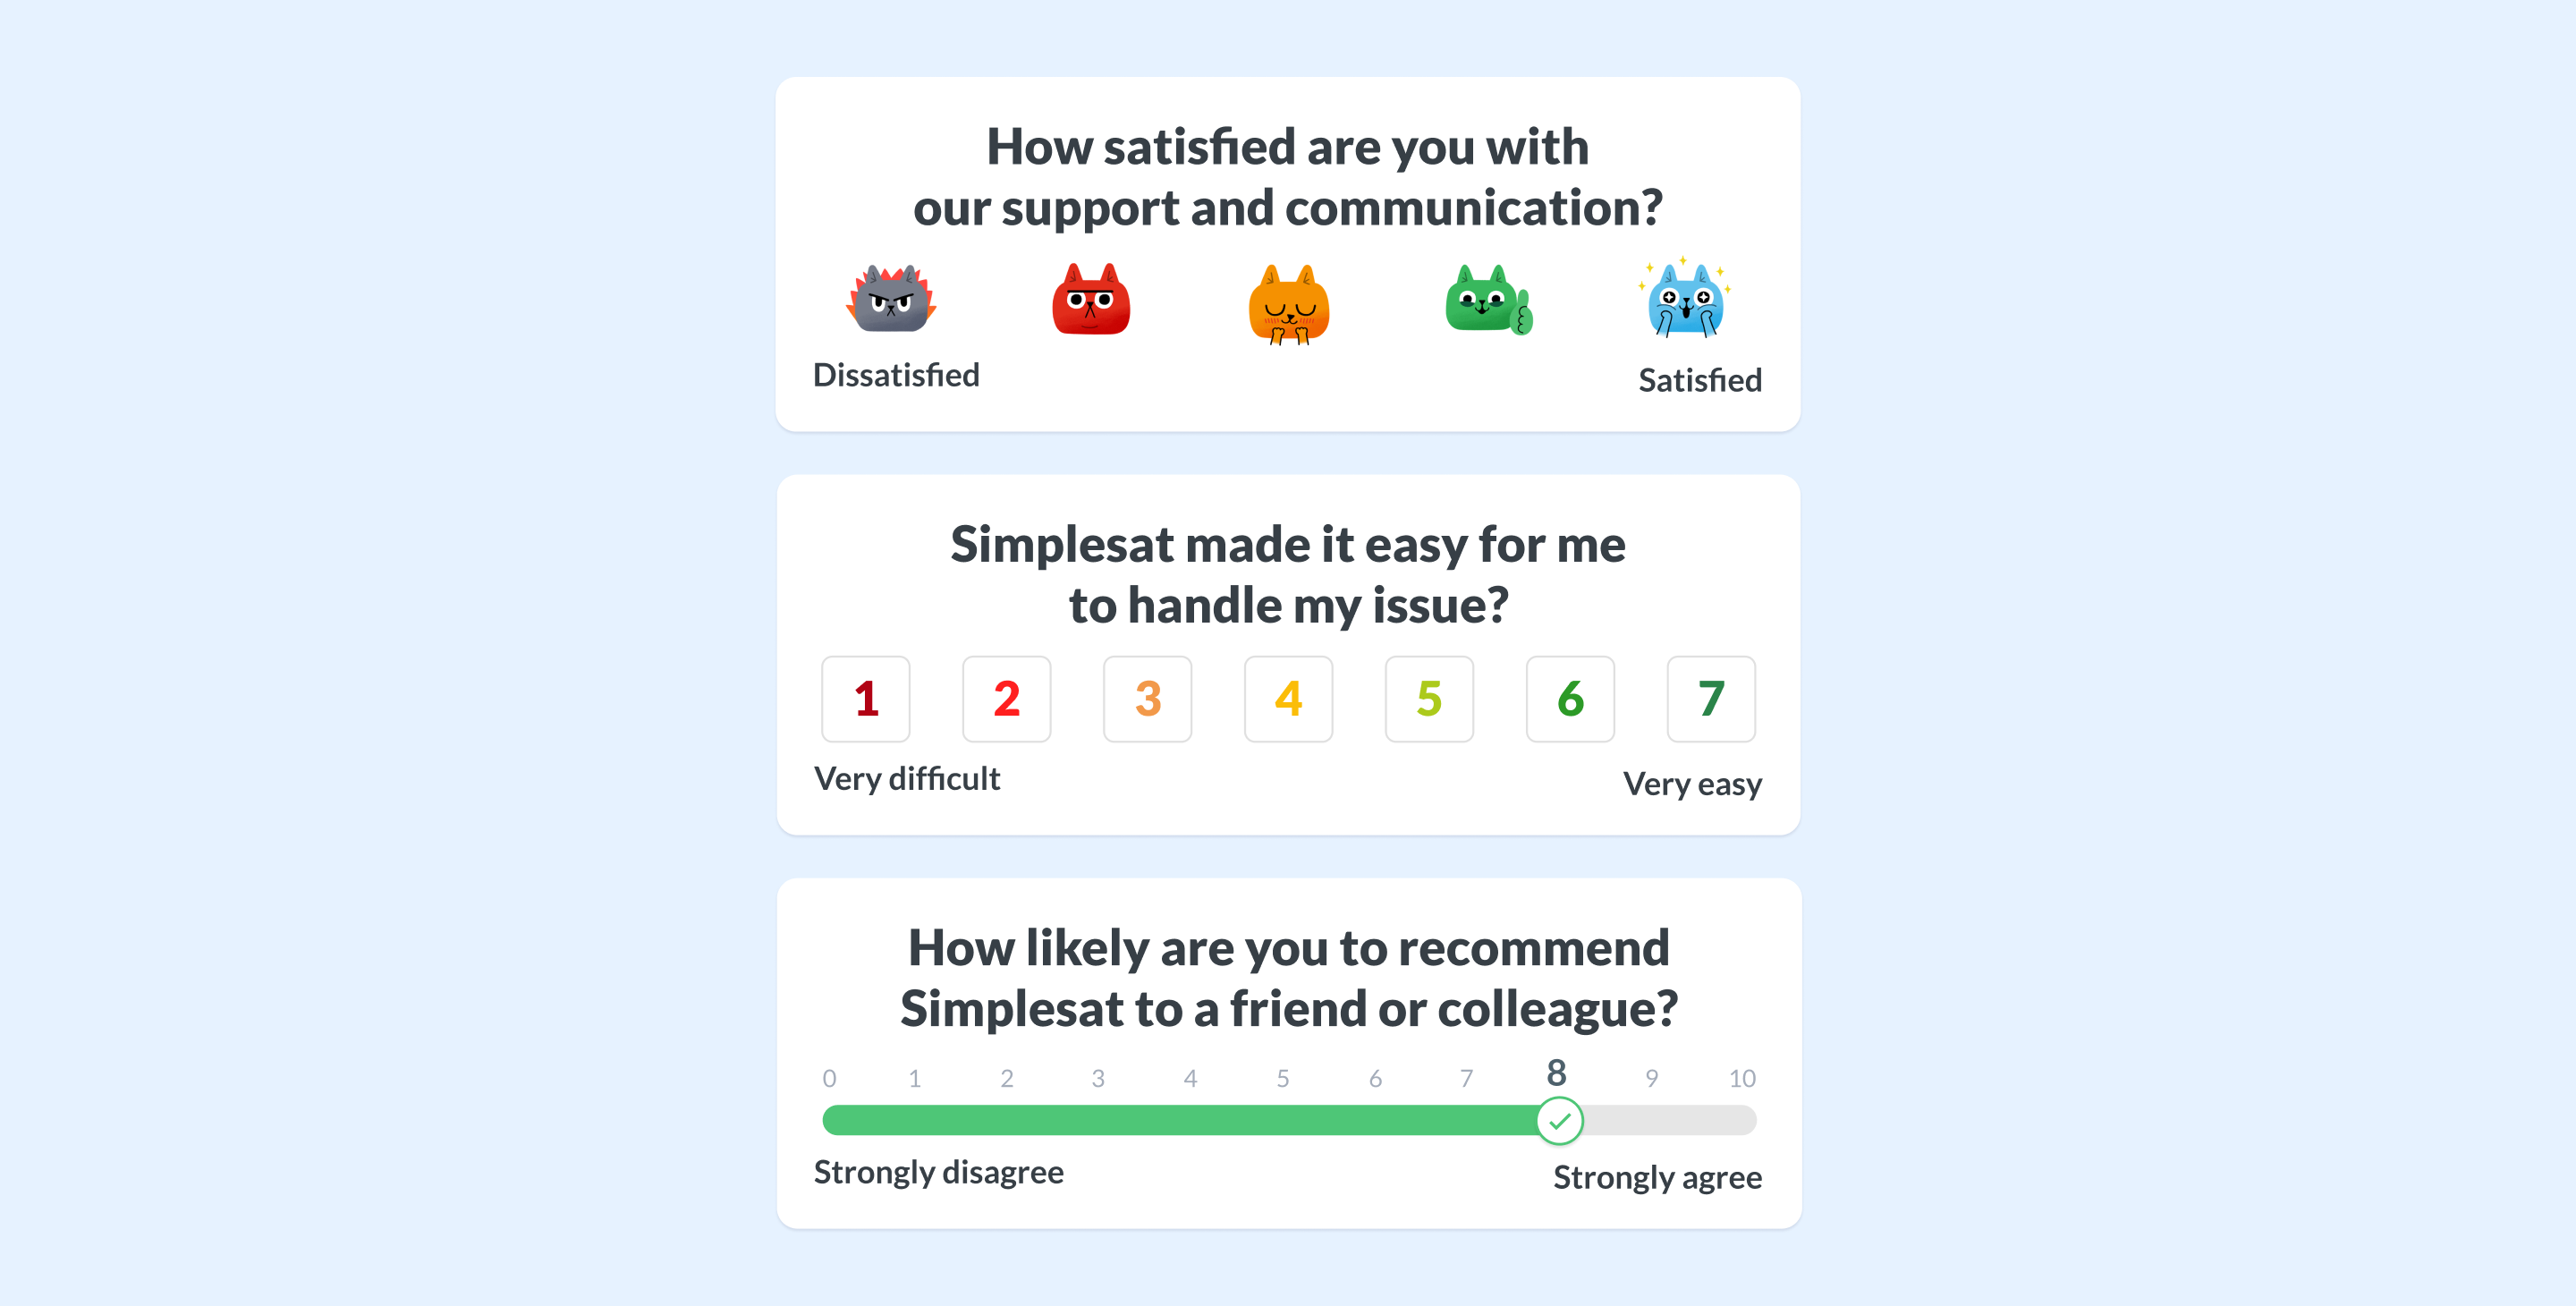
Collect impactful customer impressions with the right scale
The Likert scale remains a powerful and versatile tool for measuring customer sentiment in surveys such as
- CSAT- typically a 5-point bipolar scale, but there are many variations,
- NPS - always an 11-point unipolar scale
- CES - typically a 5-point or 7-point scale.
Likert scales allow businesses to gather nuanced insights into customer experiences, especially when used in combination with open-ended questions.
The value of the Likert scale lies in its simplicity and adaptability. Whether you're gauging satisfaction, likelihood to recommend, or the ease of interacting with a service, Likert items provide actionable data that can shape your business strategy. Ultimately, the careful design and thoughtful application of these scales enables you to capture the true voice of your customers.
Understanding feedback

