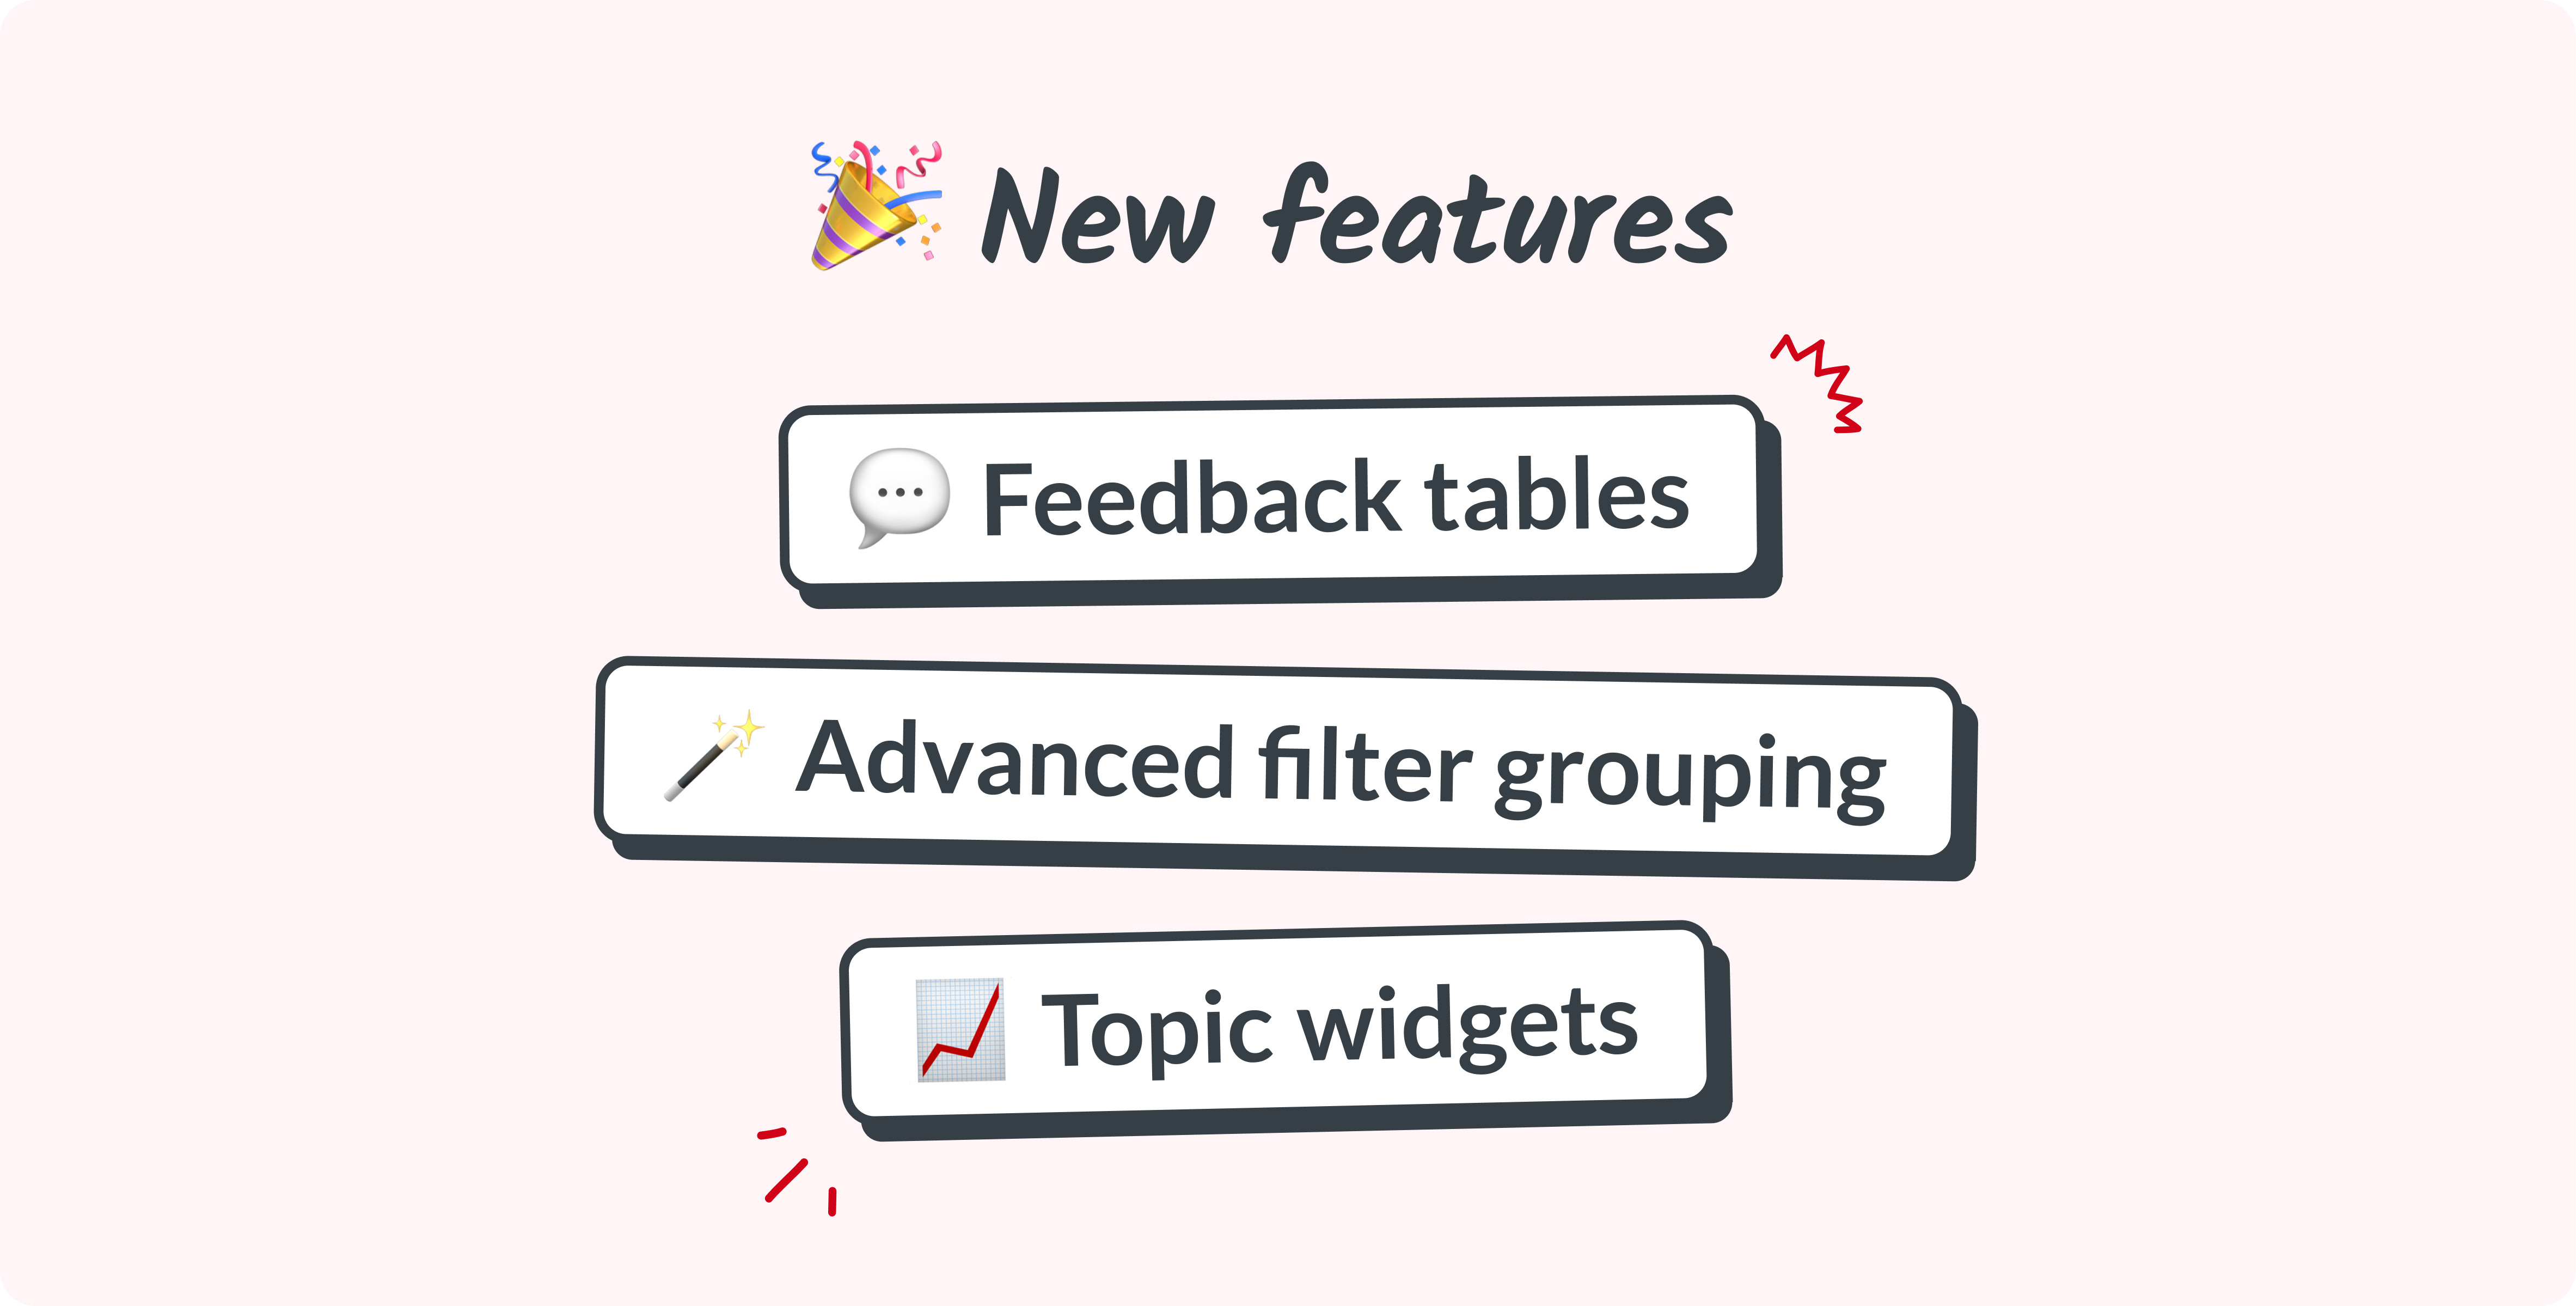
We’re excited to announce the release of three new features that will take your feedback analysis and reporting to the next level. These updates focus on providing you with greater flexibility, deeper insights, and easier reporting.
Our goal, as always, is to make feedback analysis effortless for you. These updates save time and offer even more actionable insights.
Let’s take a closer look at each feature!
Feedback tables – Tailor your data your way
Tired of using external tools just to format your feedback data the way you need?
Introducing our new feedback tables! Customize how your data is displayed from within the Simplesat dashboard, and view or export data tables that pinpoint the exact insights you need.
Key features
- View answers and responses in table format directly within Simplesat – Eliminate the need for exporting data to Excel or Google Sheets, streamlining workflows and saving valuable time.
- Customize column order and visibility to display only the data you need – Quickly access and analyze large datasets with greater efficiency, and reduce the time spent sifting through feedback data.
- Set column order and visibility before exporting to CSV – Ensure your exported files are perfectly tailored for use in other tools, drastically reducing manual adjustments and repetitive tasks.
Why it matters
This update is a game-changer for anyone who needs to prepare clean, organized reports quickly. You can now save hours of manual formatting and data cleanup by customizing everything upfront. Plus, the streamlined interface ensures your team spends less time on logistics and more time acting on insights.
💡 Pro tip: Use the table view to prepare data for seamless export, giving you a polished CSV file that’s ready to share with stakeholders.
Explore our in-depth guides to make the most of these features: Feedback tables – Simplesat feedback views guide
Advanced filter grouping – Dig deeper into your data
In order to truly understand what your customer base is thinking, you need nuanced feedback interpretation. Simplesat’s advanced filtering offers a precise lens to uncover the most relevant insights.

Key features
AND/OR logic – Combine multiple filter conditions with logical operators to fine-tune your queries.
Grouped filters – Create nested filter groups to segment your data with pinpoint accuracy.
Reusable views – Save your most commonly used filter configurations for easy access in the future.
Why it matters
Advanced filtering empowers you to extract meaningful insights from even the largest datasets. Whether you’re looking to identify trends by customer type, survey format, or sentiment score, this feature makes it easy to zero in on exactly what you need.
💡Pro tip – Use advanced filtering to compare customer satisfaction across different regions or product categories!
Explore our in-depth guides to make the most of these features: Advanced filtering – Simplesat filters guide
Topic widgets – Visualize trends and prioritize efforts
Understanding customer feedback at a glance just got easier with our new Topic widgets for dashboards. These widgets turn raw feedback data into visual insights that are easy to interpret and share.
Key features
- Topic trends widgets – Visualize a 90-day moving average of topic counts or scores, and make it easier to identify emerging trends and shifts in sentiment.
- Topic frequency widgets – Highlight recurring themes by analyzing how often specific topics arise over a selected period. This makes it easier to prioritize key focus areas with precision.
- Topic leaderboard widgets – Rank topics by their count or sentiment. These widgets provide a clear, at-a-glance comparison of top successes and challenges to guide decision-making.
- Customizable Topic widgets – Tailor reports by including or excluding specific topics, adjusting counts, and personalizing views — and create insights-rich, bespoke dashboards without limitations.
Why it matters
Visualizing feedback trends helps your team identify patterns and take action faster.Topic Widgets provide a clear, intuitive way to communicate insights to your team or leadership; they make it easier to monitor customer satisfaction, spot emerging issues, and celebrate positive feedback.
💡 Pro tip – Customize your dashboard with multiple Topic widgets to compare trends across different topics, gaining a comprehensive view of your feedback landscape.
Explore our in-depth guides to make the most of these features: Topic widgets – Dashboard widgets guide
Who will benefit?
Here’s a quick look at how each feature caters to specific roles and needs:
| Feature | Primary users | Benefit |
|---|---|---|
| Feedback table views | Data analysts, reporting professionals | Saves time with in-app data customization and direct export. |
| Advanced filtering | Power users, product managers | Provides precise data queries without technical barriers. |
| Topic widgets | Executives, CS managers, support teams | Enables high-level and granular insights for better decision-making. |
Transform feedback into action
With these new features, Simplesat makes it easier than ever to organize, analyze, and act on your customer feedback. We’re proud to provide the tools you need to drive real improvements in customer satisfaction and loyalty.
Ready to give these features a try? Log in to Simplesat now and start exploring!
About Simplesat: Simplesat is the leading omnichannel survey app designed to enhance customer feedback management across various platforms, including Zendesk, Salesforce, and Gladly. Trusted by businesses worldwide, Simplesat delivers actionable insights that drive business growth and customer satisfaction.