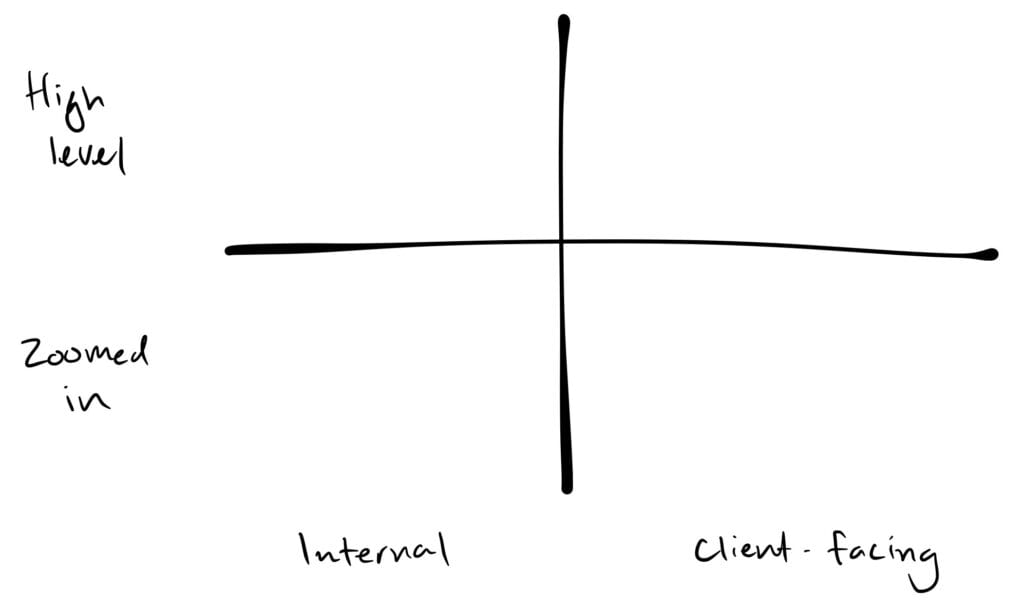
One of the top feature requests we heard at Simplesat throughout 2019 was “better reporting.” As we dug into this more and listened to our users, we began to see some trends in desired use cases, and were able to break down what “better reporting” means:
High level overview – 30,000 feet view of satisfaction score and trends over longer periods of time.
Zoomed in – Ability to view and act on ticket-specific feedback on a daily basis.
Client-facing – Preparing data and reports for quarterly business reviews.
Internal focused – Sharing feedback throughout the company for team motivation, and to drive strategy.
To get it right, each of these use cases requires a combination of features, all working together. We’re proud to announce the latest round of updates aimed at improving reporting for you, your team, and your customers.
Advanced filtering
Filtering survey stats is now easier and even more powerful.
New filtering fields
We’ve added the options to filter by team members, as well as all custom attributes associated with a customer or ticket.
We’re especially excited about the customer custom attributes, as this now allows you to take advantage of all of the fields that you have synced, or imported through CSV.
Autocomplete for easier access
When you choose a field to filter by, you’ll see a preloaded list with available data. This makes it much easier to find the field you’re looking for – and assures you that you’re only filtering by data that exists in your Simplesat account.
Filtering fields come pre populated for quicker and more reliable searches
The new line chart now displays your satisfaction score based on a 90-day moving average. This means that any given datapoint on the chart represents the score from that day and 90 days prior.
If you’re like most of our users, your line chart will look pretty flat. This is still meaningful. Having a flat baseline will help you spot longer term trends – in either direction.
Easily see the shape of satisfaction trends
New column chart means you never miss critical feedback
The new chart visualizes incoming feedback by day, week, month, or quarter. This makes it incredibly easy to spot recent neutral or negative ratings.
Click on sentiment labels in the legend to toggle columns in real time!
Answers drilldown lets you zoom in on any feedback
The feature we’re perhaps the most excited about is the new drilldown popup that you can launch from just about any stat on your survey’s reporting page.
This makes it so easy to see exactly the feedback you’re looking for, without even leaving the page.
You can even launch the drilldown from the column chart!
Reveal answers for each day, week, month, or quarter
Once you have the drilldown popup opened, you can click on specific data like the customer name or company to open their individual pages in a new tab.
View stats by client with the new company leaderboard
Click column headers to sort by satisfaction score, or count of positive/neutral/negative ratings.
Combined with the new drilldown popup, it’s now easier than ever to move between viewing high level stats, and zooming in on individual details.
View individual answers by clicking any stat in leaderboards
Eliminating spam feedback through invisible Google reCAPTCHA
Unrelated to reporting features but equally as important, we deployed Google’s invisible reCAPTCHA solution to all web surveys in order to fight spam clicks.