Average CSAT and NPS scores by industry and company size in 2026
By Eric Sangerma, Head of Growth at Simplesat
Simplesat's 2026 benchmark report puts average CSAT at 87.8% and NPS® at 52, based on 3.5 million survey responses collected through Simplesat during 2025. But a useful comparison starts with your industry. Technology leads on satisfaction at 92.4% CSAT yet ranks seventh of eight industries on NPS, which shows how satisfaction and willingness to recommend can tell different stories.
What is the average CSAT score in 2026?
The CSAT benchmark is 87.8%, based on 2,899,004 responses collected during 2025. CSAT (customer satisfaction score) is the share of survey responses rated 4 or 5 on a five-point scale.
Companies cluster near the top of that scale. In the 2025 data, 62.5% of companies scored 90% or above, and fewer than one in ten scored below 60%.
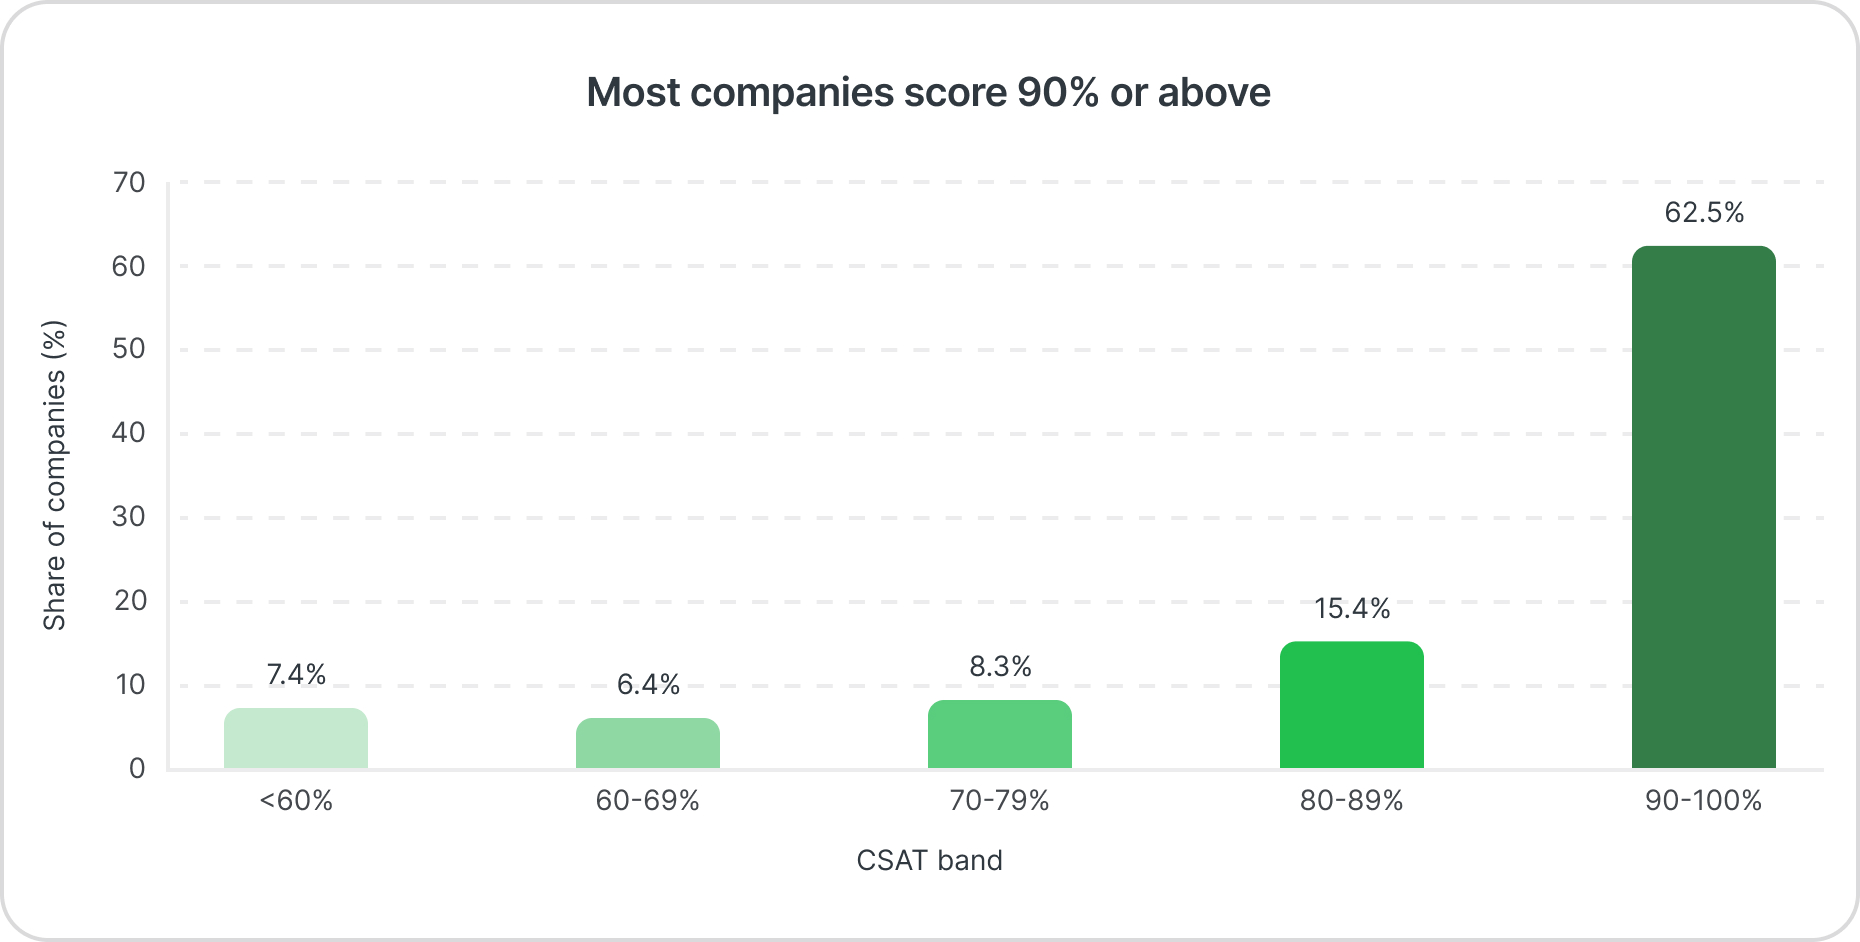
Monthly CSAT stayed between 86.3% and 89.1% throughout 2025.
What is a good NPS score in 2026?
The NPS benchmark is 52, based on 605,443 responses. NPS (Net Promoter Score℠) asks customers how likely they are to recommend a company on a scale from 0 to 10. Promoters answer 9 or 10, detractors answer 0 to 6, and the score is the percentage of promoters minus the percentage of detractors, which gives a range from -100 to 100.
In the 2025 data, 69.3% of responses came from promoters, 13.7% from passives (the 7s and 8s), and 17.0% from detractors.
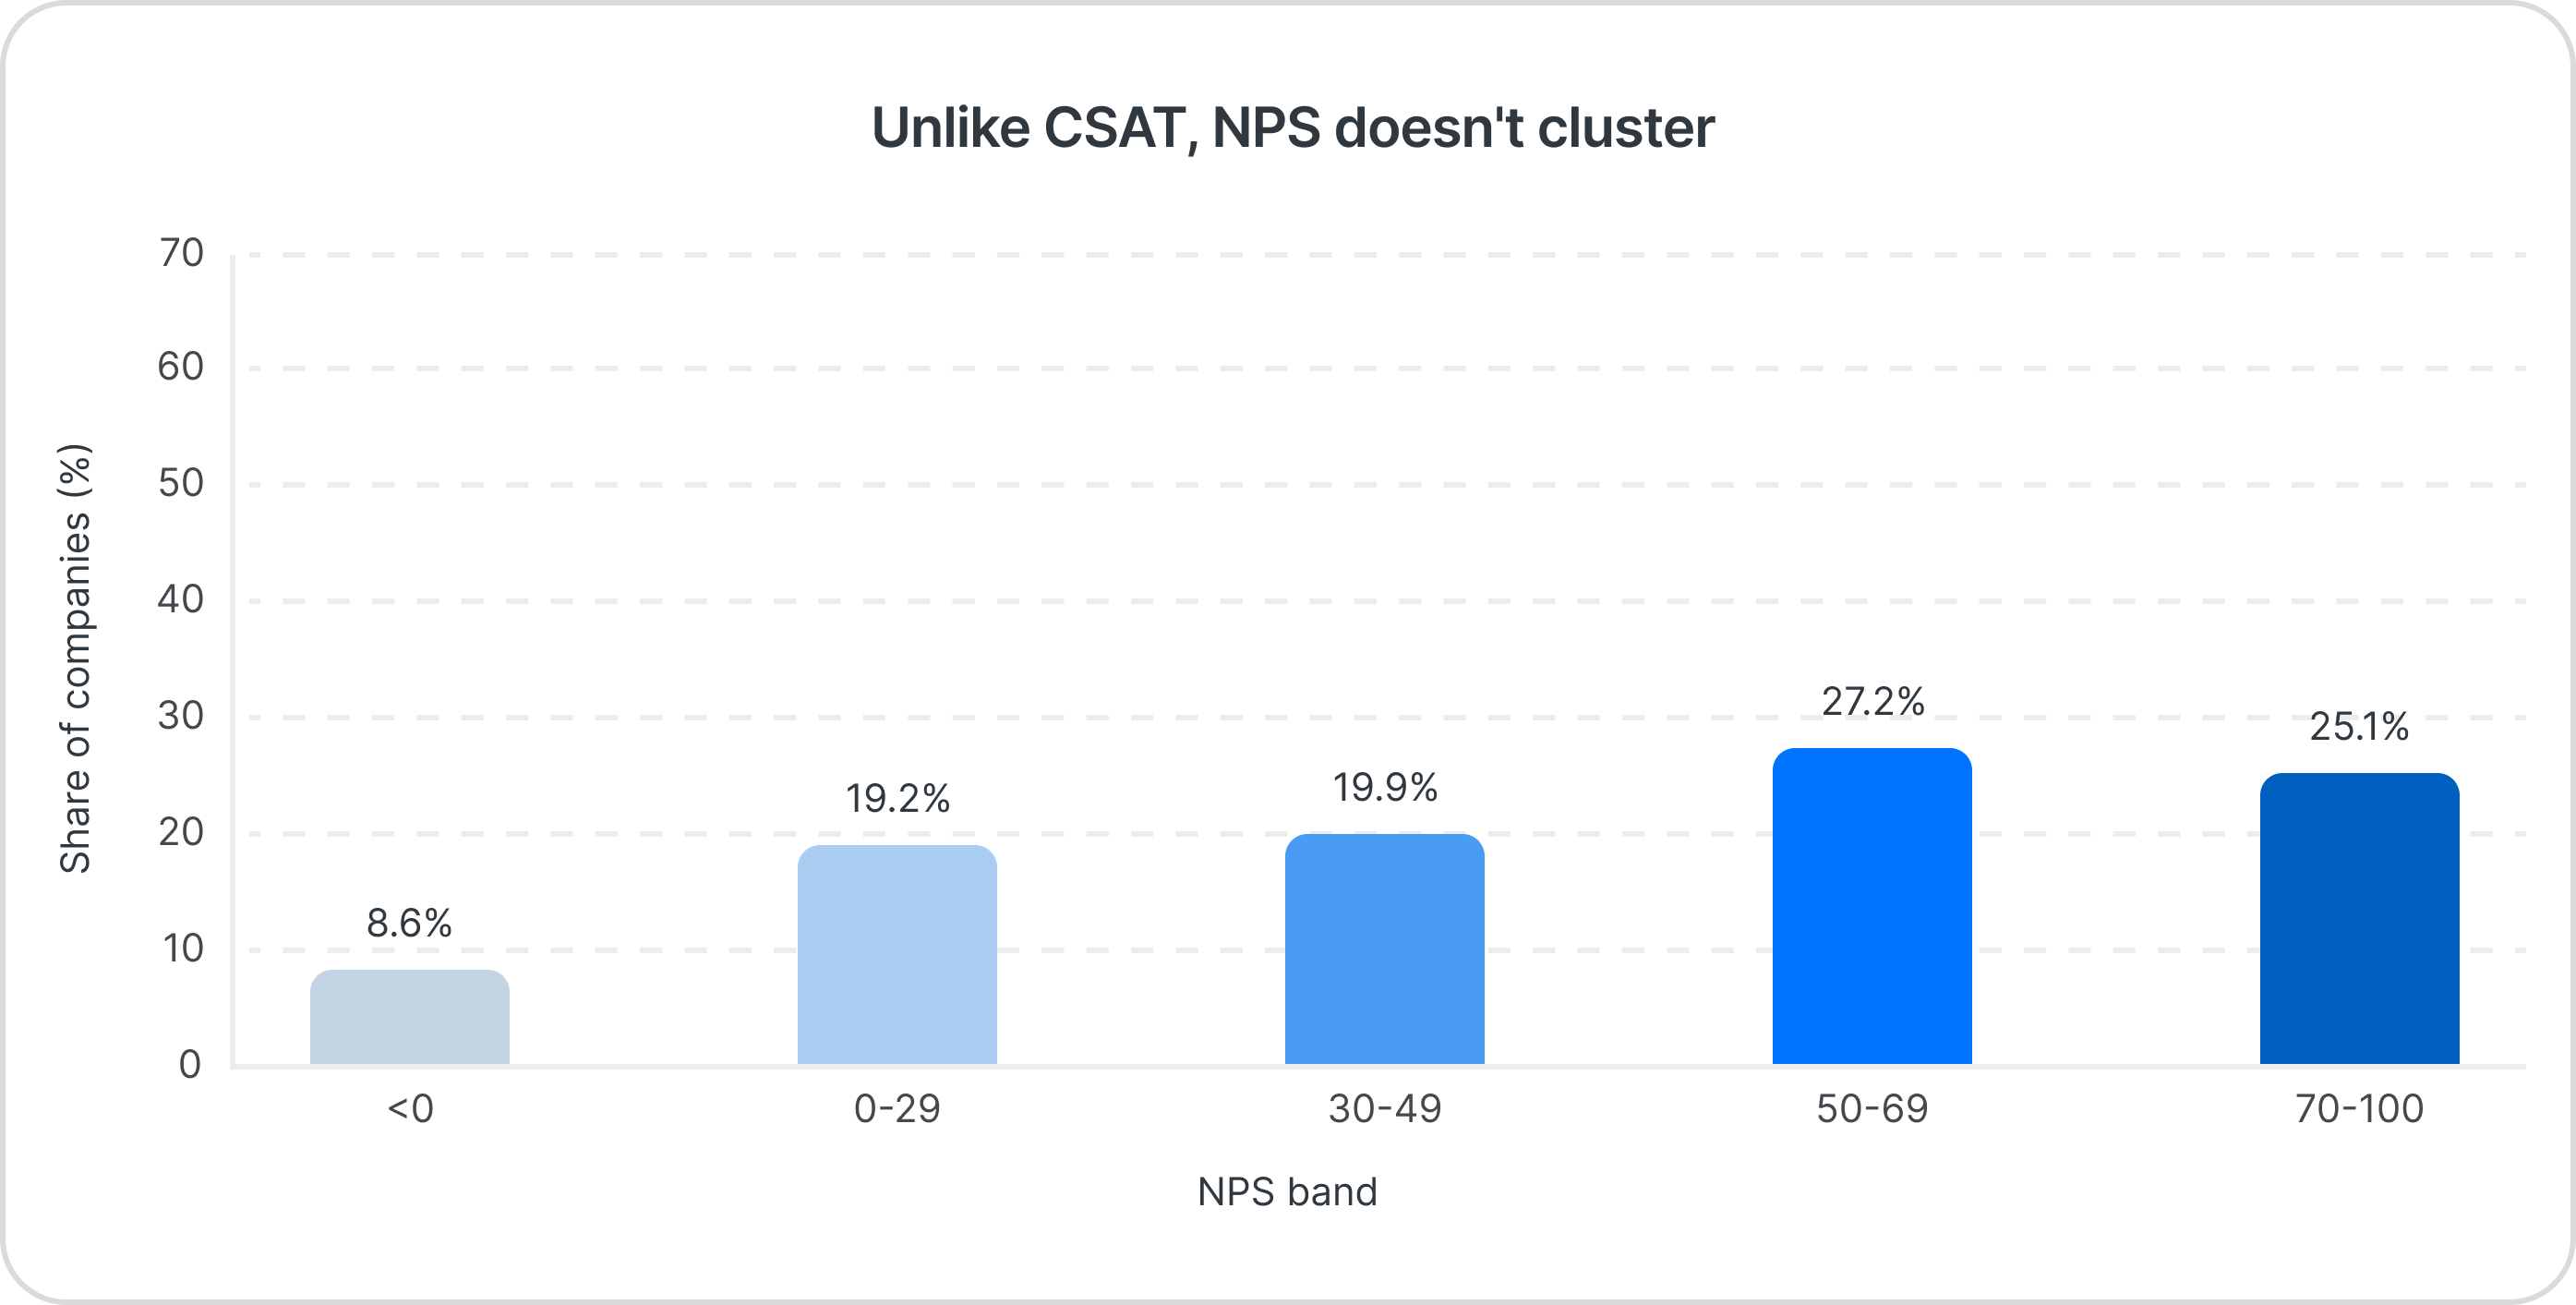
NPS scores are spread far more widely than CSAT scores. Just over half of companies (52.3%) scored 50 or above, and a quarter scored 70 or above. About one in twelve had a negative NPS, meaning more of their customers were detractors than promoters. An NPS of 70 puts you in the top quarter of companies, whereas a 90% CSAT puts you with the majority. Monthly NPS stayed between 50 and 56 all year, with no clear trend.
What is the satisfaction-advocacy gap?
The satisfaction-advocacy gap is the mismatch between how satisfied customers are and how willing they are to recommend you. CSAT tracks the day-to-day experience, usually a single support interaction. NPS reflects the broader relationship with the company. A customer can rate a support interaction 5 out of 5 and still hold back from recommending the company as a whole.
Industry rankings show the gap clearly. Technology has the highest CSAT of any industry at 92.4%, and its NPS of 45 ranks seventh of eight. Consumer Products is the reverse case, with the lowest CSAT at 73.4% and an NPS of 60, level with Professional Services and behind only Healthcare & Life Sciences at 74.
The gap matters in practice because far more companies measure CSAT than NPS. A team that tracks only CSAT sees a high score, the kind most companies report, and has no view of whether those customers would recommend them.
CSAT and NPS benchmarks by industry
CSAT varies far more by industry than by company size. The spread between the highest- and lowest-scoring industries is 19 points, against 6.7 points across company size bands.
| Industry | CSAT | NPS |
|---|---|---|
| Technology | 92.4% | 45 |
| Industrial & Manufacturing | 91.3% | 46 |
| Professional Services | 90.7% | 60 |
| Healthcare & Life Sciences | 88.6% | 74 |
| Energy & Utilities | 86.0% | 58 |
| Marketing & Media | 80.7% | 43 |
| Retail & Wholesale | 78.5% | 47 |
| Consumer Products | 73.4% | 60 |
Each industry group combines related lines of business. Technology, the largest group in the dataset, covers software, IT services, networking, and hardware.
The top three industries on CSAT are separated by less than two points. On NPS, Healthcare & Life Sciences leads at 74, 14 points ahead of the next-highest industries, while just four points separate the bottom four: Retail & Wholesale, Industrial & Manufacturing, Technology, and Marketing & Media.
These differences are why the overall average is a poor yardstick for most teams. A 90% CSAT is below the Technology benchmark of 92.4%, and for a retail business the same score is more than 11 points above the Retail & Wholesale average of 78.5%.
CSAT and NPS benchmarks by company size
CSAT varies by just 6.7 points across company size bands, with no clear trend. Companies with 11 to 50 employees score highest at 90.3%, and those with 201 to 500 employees score lowest at 83.6%, after which satisfaction rises again. If your CSAT is below benchmark, company size is unlikely to be the main reason.
NPS behaves differently. There's no clear pattern among companies with fewer than 200 employees, but from 201 to 500 employees onward, NPS is lower at every band. Companies with 1,001 or more employees average an NPS of 35, 17 points below the band before it, which is the largest difference between any two neighboring size bands in the report.
That puts large companies in a different position when they read their scores. A company with 1,001 or more employees can sit well below the overall benchmark of 52 and still be at or above the average for its size.
How to compare your CSAT and NPS to the benchmarks
Use your industry benchmark if your industry appears in the table above, and the overall averages of 87.8% CSAT and 52 NPS if it doesn't. Company size works as a second reference. Where the two disagree, industry is usually the better comparison because scores vary more by industry than by size.
With both scores placed above or below their benchmarks, you'll be in one of four situations.
Strong on both. Keep monitoring both scores, and use the feedback you collect to strengthen the wider customer relationship.
Good support, weak advocacy. Customers rate their support interactions well, so the cause likely lies elsewhere. Look at product, pricing, or the wider experience. If the main pain point is unclear, segment your feedback by topic and ask follow-up questions.
Loyal despite the friction. Customers recommend you even though support falls short. That goodwill can fade if the problems continue, so fix the support issues quickly. A technology company with 90% CSAT and an NPS of 50 would be in this group: below its industry on satisfaction and above it on advocacy.
Struggling on both. Start with support. CSAT reflects individual interactions, so improvements there should show up sooner.
Frequently asked questions
What is a good CSAT score?
The 2026 CSAT benchmark is 87.8%. High scores are common: across the full year, 62.5% of companies scored 90% or above, and almost four in five scored 80% or above. For a more useful comparison, check your industry benchmark, which ranges from 73.4% in Consumer Products to 92.4% in Technology.
What is a good NPS score?
The 2026 NPS benchmark is 52. Just over half of companies score 50 or above, and 70 or above puts you in the top quarter. Industry averages range from 43 in Marketing & Media to 74 in Healthcare & Life Sciences, and companies with 1,001 or more employees average 35, so the same score can be strong in one context and weak in another.
What is the difference between CSAT and NPS?
CSAT measures satisfaction with a specific experience, usually a support interaction, on a five-point scale, and it's reported as the percentage of 4 and 5 ratings. NPS measures how likely a customer is to recommend you, on a 0 to 10 scale, and reflects the relationship as a whole. Because CSAT reflects individual interactions, improvements to support should show up there sooner.
Should I measure CSAT or NPS?
Both, if you can. The benchmark data shows that one shouldn't be used as a proxy for the other. Consumer Products has the lowest average CSAT of any industry, at 73.4%, and an NPS of 60, one of the highest. A team in that industry judging itself by CSAT alone would underrate how willing its customers are to recommend it.
Why might my score differ from the benchmark even if my service is good?
Several factors can shift a score without any change in service quality. With a small number of responses, each rating carries more weight, so scores swing more. Rating habits differ across countries and industries, and two equally happy customers might give the same experience a 4 and a 5. Complex or frustrating requests tend to score lower even when handled well. Question wording also matters: "Were you satisfied?" and "Did we solve your problem?" can produce different answers about the same experience, as can surveys sent at different points after an interaction.
How was this benchmark calculated?
CSAT is the percentage of responses rated 4 or 5 on a five-point scale. NPS is the percentage of promoters (9 or 10) minus the percentage of detractors (0 to 6), producing a score from -100 to 100.
Headline and segment averages are calculated from monthly account scores. Within each month, every account carries equal weight regardless of response volume, so an account with 10 responses counts the same as one with 1,000. Distribution charts use one full-year score per company and are calculated separately.
The report covers 3,504,447 responses collected through Simplesat between January 1 and December 31, 2025: 2,899,004 CSAT responses and 605,443 NPS responses. Companies that asked to be excluded from benchmarking aren't included, and segments with fewer than five companies or fewer than 1,000 responses were left out. A small number of internal and test accounts remain in the dataset, together representing less than 0.3% of responses. Company size is based on employee count, and companies with unknown employee counts are excluded from the size comparisons.
All figures are aggregated, so none can be traced to a single company. Every company in the dataset uses Simplesat and actively collects feedback, so treat these as benchmarks for companies using Simplesat rather than a representative sample of all businesses. The full methodology is in the report.
See the full 2026 CSAT & NPS benchmark report
The full report adds the CSAT and NPS figures for every company size band, a four-step method for improving your scores one segment at a time, and a worked example that follows a composite retail brand from benchmark comparison to its first results check. It also includes the complete methodology.
Citing this report: Simplesat, 2026 CSAT & NPS Benchmark Report. Please link to simplesat.io/csat-nps-benchmarks.
Net Promoter®, NPS®, NPS Prism®, and the NPS-related emoticons are registered trademarks of Bain & Company, Inc., NICE Systems, Inc., and Fred Reichheld. Net Promoter Score℠ and Net Promoter System℠ are service marks of Bain & Company, Inc., NICE Systems, Inc., and Fred Reichheld.
Related articles