Published
October 27, 2026
Roundup
October 2026 roundup: score over time and the Published filter
When you report your score upward, the first question in the room is which way it's moving. Until now, answering it meant stepping the date filter back one month at a time and copying each score into a spreadsheet.
Now it's built in. Your dashboard's moving average spans 90 days and blends a bad month into the ones around it. This line gives each period its own score, so a bad month shows up as a bad month.
Score over time
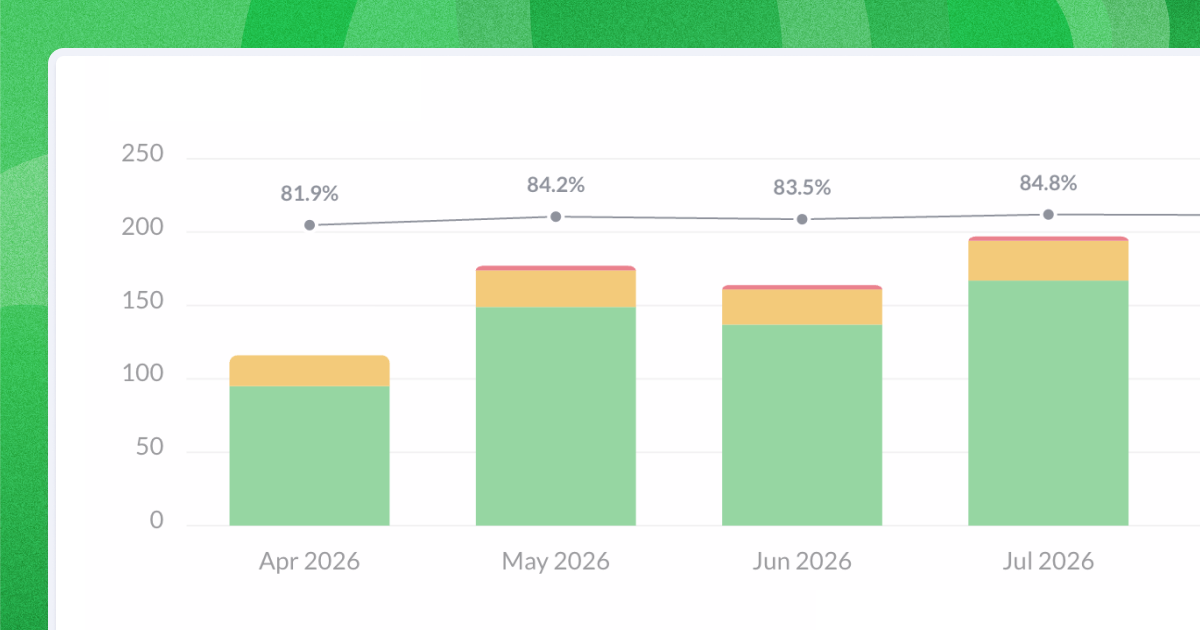
Your score now shows as a line on the Answers over time chart, one point for each day, week, month or quarter. Set the range to Last 365 days and pick Month, and you have a year of monthly scores in one chart. Download it as a PNG and the line comes with it, ready to drop into this month's report.
Also shipped
- Published filter. The Feedback page can now show only the comments you've published as testimonials, so you can see what's public without scrolling for orange megaphones. Details are in the Feedback article.

